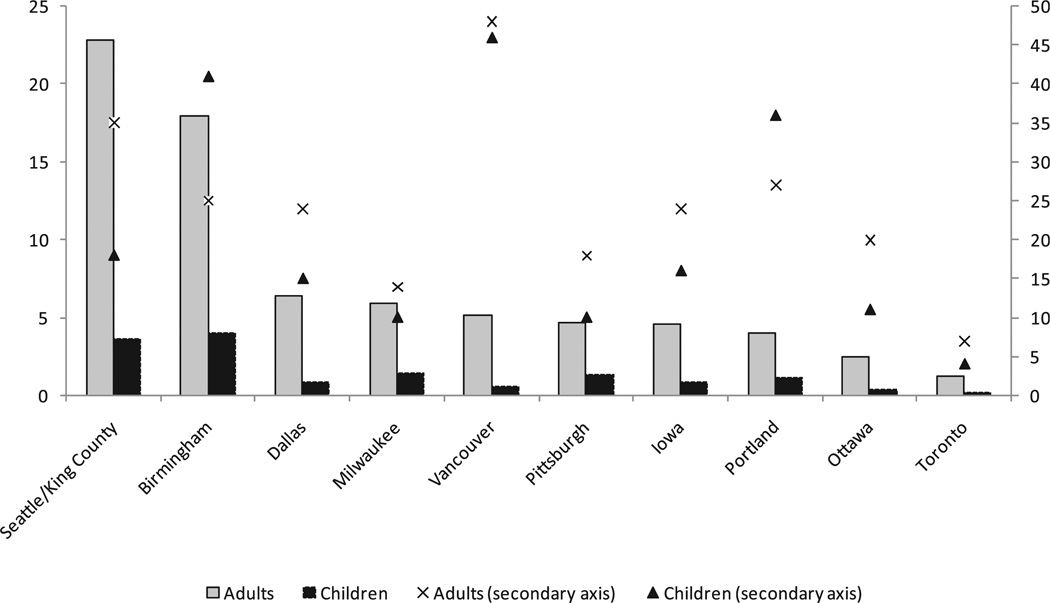
Figure 2.
Rate of out-of-hospital advanced airway procedure use among injured children (n = 229) and adults (n = 1431) at 10 sites. The primary (left-hand) axis and bar graphs represent age-specific trauma airway procedure rates per 100,000 population. The secondary (right-hand) axis and symbols demonstrate the age-specific airway procedure rate per 100 “major trauma” (field physiologic abnormality) patients. Axes have been truncated for clarity. Primary (left vertical) axis legend = trauma airway procedure rate per 100,000 population. Secondary (right vertical) axis legend = airway procedure rate per 100 major trauma patients.

