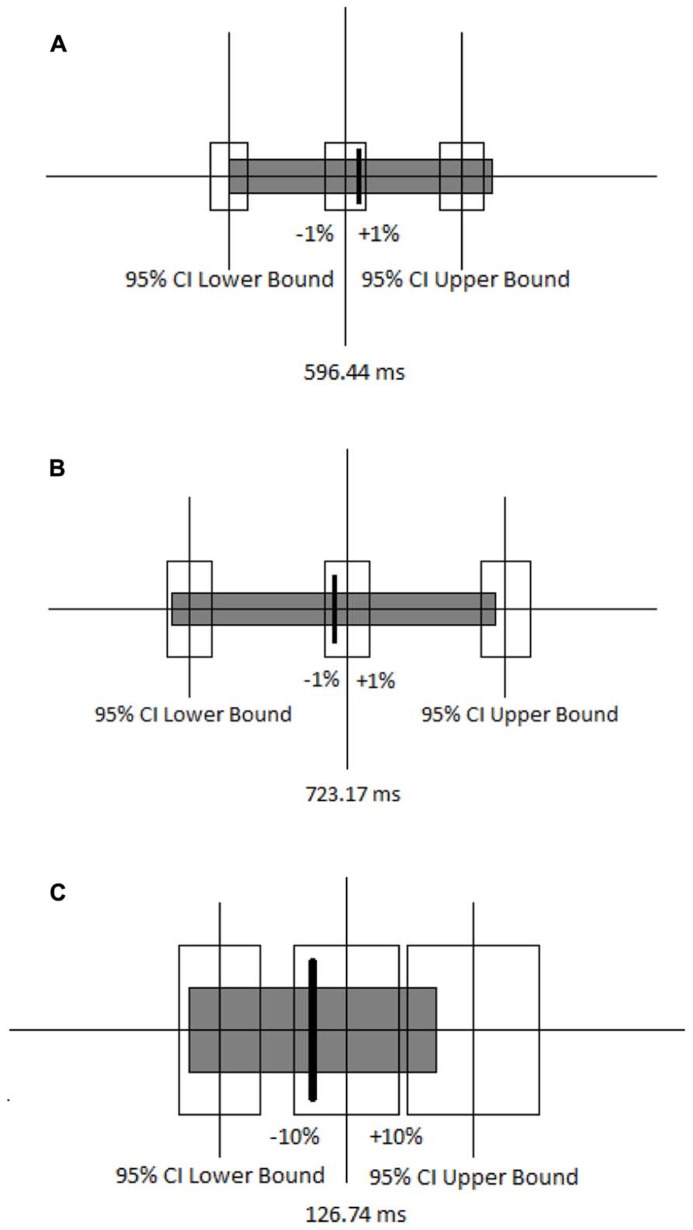
FIGURE 4.
(A) Ninety-five percent confidence interval around the mean RT for the congruent block when it came first is shown by the unfilled boxes. The thick line and gray box indicate the mean and 95% confidence interval for congruent trials when they came second. (B) Ninety-five percent confidence interval around the mean RT for the incongruent block when it came first is shown by the unfilled boxes. The thick line and gray box indicate the mean and 95% confidence interval for incongruent trials when they came second. (C) Ninety-five percent confidence intervals around the mean RT for the differences between the congruent and incongruent blocks when the congruent block came first is shown by the unfilled boxes. The thick line and gray box indicate the mean and 95% confidence interval for the difference between the congruent and incongruent blocks when the incongruent block came first.

