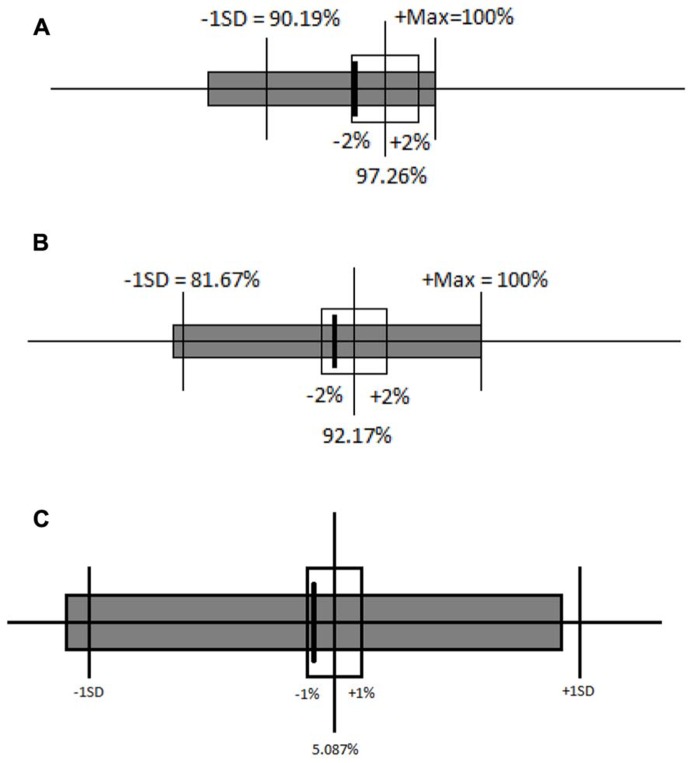
FIGURE 6.
(A) Ninety-five percent confidence interval around the mean accuracy for the congruent block in the congruent-first condition (unfilled boxes and solid lines) and comparison to the incongruent-first condition (solid box), plus or minus 2%. (B) Ninety-five percent confidence interval around the mean accuracy for the incongruent block in the congruent-first condition (unfilled boxes and solid lines) and comparison to the incongruent-first condition (solid box), plus or minus 2%. (C) Ninety-five percent confidence interval around the mean difference in accuracy between congruent and incongruent blocks in congruent-first and incongruent-first conditions. Solid lines represent the accuracy difference in the congruent-first condition and the gray box represents the accuracy difference in the incongruent-first condition.

