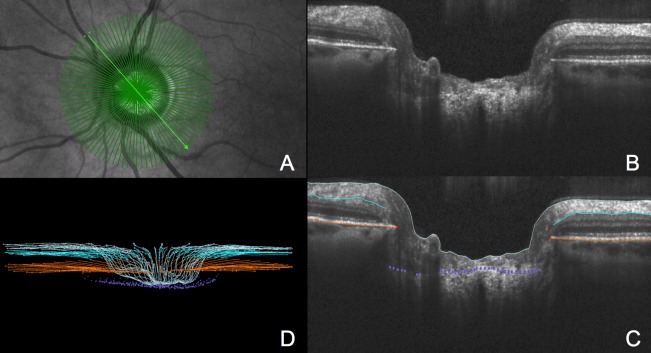
Figure 1.
Settings were 15° scan, 48 radial B-scans, 768 A-scans/B-scan, and each B-scan was the average of n = 9 repetitions. (A) IR image shows 48 radial B-scan pattern overlay. (B) Representative B-scan as described in the legend to (A). (C) Delineated B-scan shown in (B). Light blue lines indicate the ILM, turquoise lines the posterior surface of the RNFL, orange lines are the posterior surface of the BM/RPE complex, red points are the BMO, and purple points are the ALCS. (D) Point cloud of delineated points from the 24 radial B-scans that were delineated as a subset (see Subjects and Methods).

