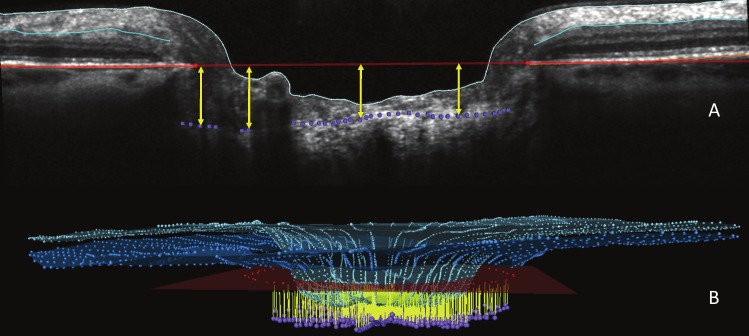
Figure 3.
ALCSD measurement is shown. (A) ALCSD (yellow arrows) was quantified as the perpendicular distance from each delineated ALCS point to BMO reference plane (seen in cross-section as a red line) that met the criteria for inclusion (Fig. 2). (B) Mean ALCSD was the average of all ALCSD measurements (yellow) in 3D space for the 24 radial B-scans that were delineated for each ONH. The ILM (light blue) and outer RNFL (turquoise) are also shown.

