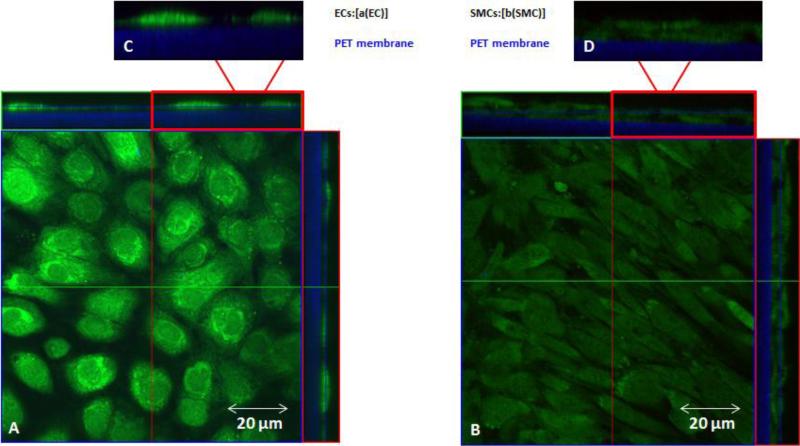
Figure 7.
Confocal images of cell tracker green localization in BAEC and BASMC monocultures grown in 10FB-MEM on PET membrane. The central portion of each panel is an en face view of the BAEC A, (left panel) and BASMCs ,B (right panel), shown from the Z-axis ,C-D (top,left and right) are cross sectional views in the Z-plane of each panel, and the PET membrane (blue). Note that there is no Celltracker green in the membrane region.

