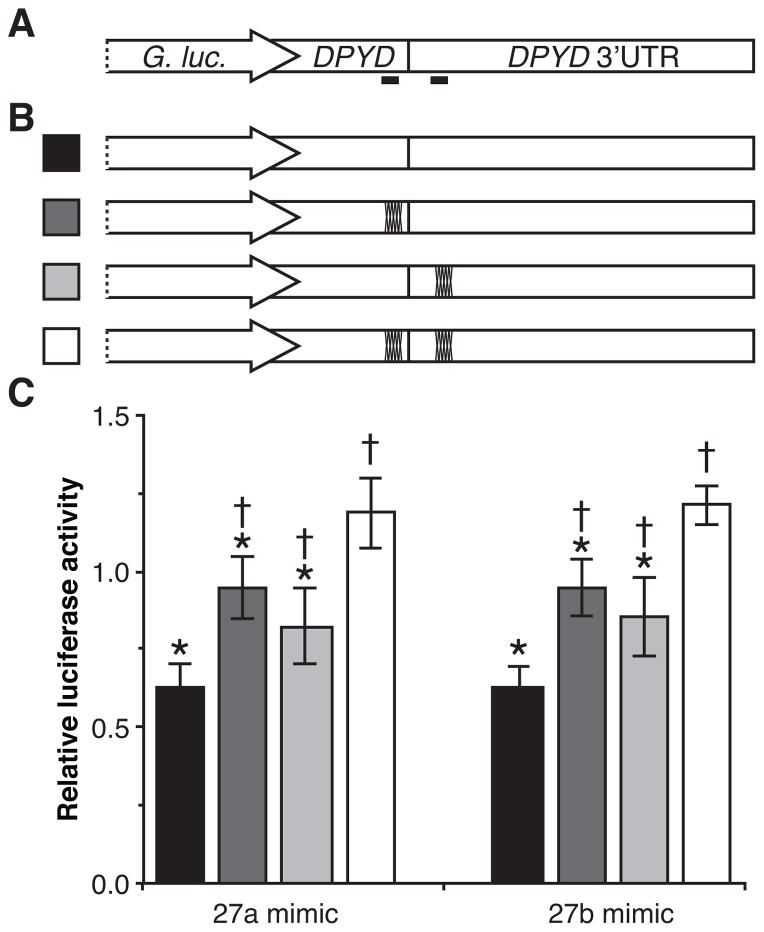
Figure 4. MiR-27a and miR-27b recognize both predicted target sites in DPYD.
A, the 3′ UTR and 56 nucleotides of upstream coding ORF sequence of DPYD were cloned into expression vectors directly downstream of the Gaussia luciferase gene. The locations of the predicted miR-27a and miR-27b binding sites are indicated as solid black bars below the diagram. B, expression vectors harboring mutations in the predicted microRNA binding sites were generated. Dark marks on the diagram indicate that mutations were introduced into that particular site. Stable clonal HCT116 cell lines expressing each of the indicated vectors were generated. Three clonal lines each were generated expressing the single-site mutations (dark gray and light gray). Four clonal lines were generated to express the un-mutated construct (black) and the double-site disruptions (white). C Relative luciferase activity was determined following transfection with RNA mimics of miR-27a, miR-27b, and a non-targeting control microRNA. Results were normalized to the non-targeting control. Each cell line was transfected and relative luciferase activity measured in triplicate. The mean relative luciferase activity of clonal lines is presented +/− SD. P values were calculated using the two-tailed unpaired Student’s t test assuming normal distribution. Constructs showing significantly lower luciferase activity compared to clones expressing the double-mutations construct (P<0.05) are indicated with an asterisk; those showing significantly higher luciferase activity than clones expressing the un-mutated construct (P<0.05) are indicated with a dagger.

