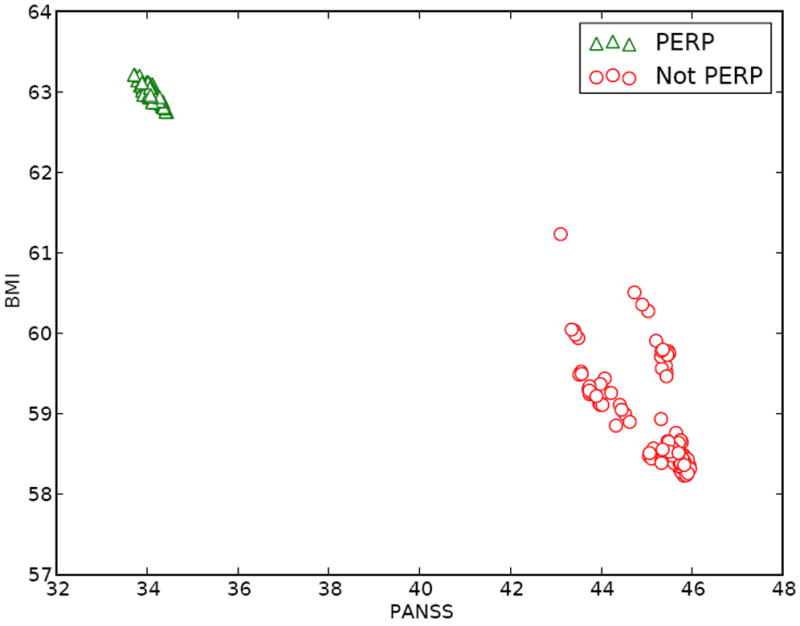
Figure 3.

Q̂1B(h1, a1, τ2) against Q̂1P(h1, a1, τ2) across τ2 ∈ F̃ (π̂2Δ) for a single patient with history (panss = −25.5, bmi = −15.6) in the CATIE data. Note, that while there are 61,659 polices in F̃(π̂2Δ) many of these yield similar predicted values for Q̂1B(h1, a1, τ2) and Q̂1P(h1, a1, τ2); we have plotted a random subset to make individual points more clearly visible. This display suggests that a patient presenting with H1 = h1, choosing perphenazine (PERP) is associated with better expected outcomes on BMI but worse on PANSS under feasible second stage rules.
