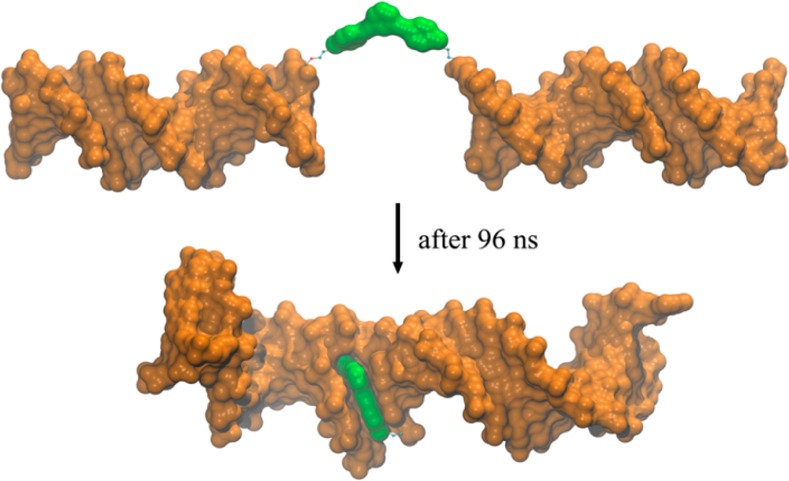
Figure 5.

Molecular surface representations of initial (top) and final (below, after 96 ns) structures of the control-[5′-C-3′] system obtained from MD simulations. The organic core 3 is shown in green color. The two 15 bp DNA duplexes are brought together by the hydrophobic nature of 3. Two MD simulations were carried out; see Movie S1 in the Supporting Information for further details.
