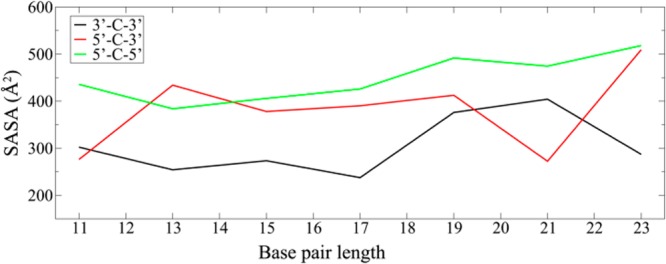
Figure 8.

SASA values of the organic cores in SMDH2 cyclic dimers as a function of DNA length. The black, red, and green trends represent the results for [3′-C-3′]:[3′-C-3′]′, [5′-C-3′]:[5′-C-3′]′, and [5′-C-5′]:[5′-C-5′]′, respectively, where the lowest SASA values for the organic cores were extracted from simulated annealing MD simulations with final restraint energies and duplex rmsd values less than 10 kcal/mol and 10 Å, respectively.
