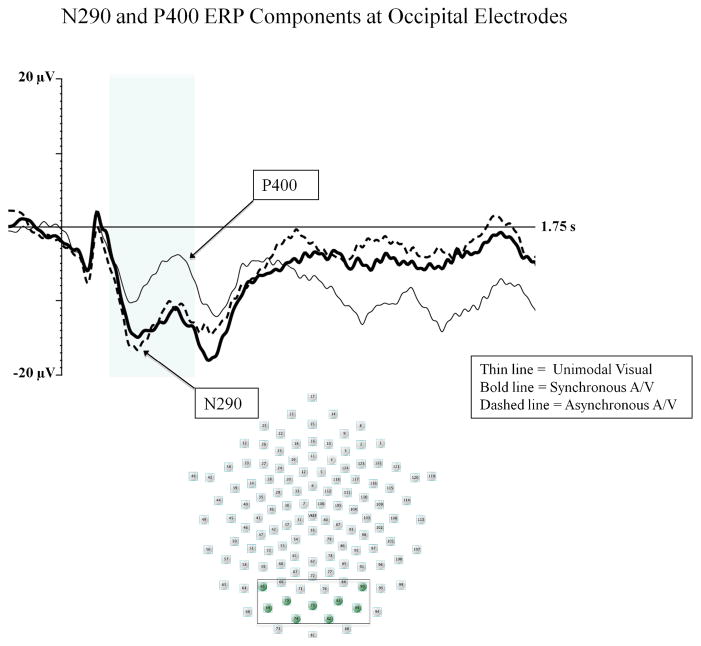
Figure 2.
The N290 and P400 components are shown for the unimodal visual (thin line), synchronous audiovisual (bold line), and asynchronous audiovisual (dashed line) conditions from Experiment 1. The Y-axis represents the amplitude of the ERP in microvolts, and the X-axis represents time following stimulus onset. The time-window of the component analysis is shaded on the X-axis. The peak of the N290 and P400 components is indicated with the arrows. The positioning of the electrodes included in the occipital cluster are shown in the electrode montage (see box and shaded electrode sites).

