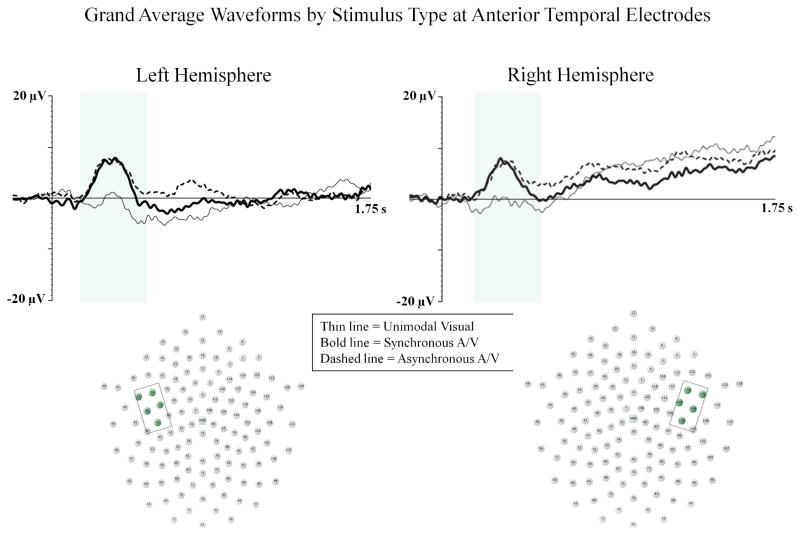
Figure 3.
The Auditory P1 component is shown for the unimodal visual (thin line), synchronous audiovisual (bold line), and asynchronous audiovisual (dashed line) conditions from Experiment 1. The Y-axis represents the amplitude of the ERP in microvolts, and the X-axis represents time following stimulus onset. The time-window of the component analysis is shaded on the X-axis. The positioning of the electrodes included in the anterior temporal clusters are shown within each electrode montage (see box and shaded electrode sites).

