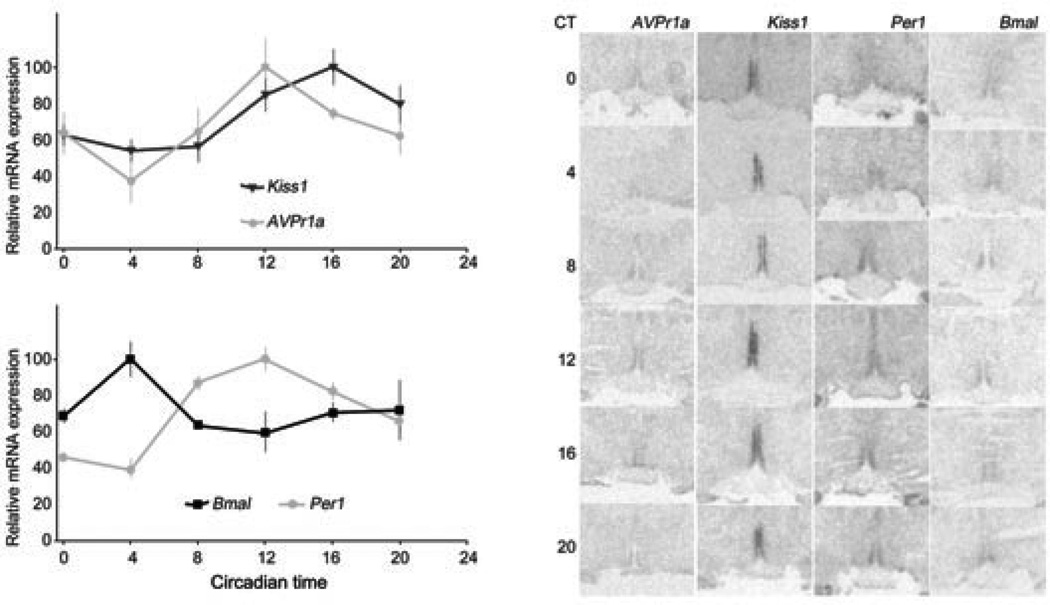
Figure 1.
Relative mRNA expression measured every 4 h for 24 h from 4–5 animals released into DD from a 12:12 LD cycle 24 h prior to the first sacrifices. All 24-h profiles show a significant rhythm (one-way ANOVA, see text for details). Avpr1a peaks one time point before Kiss1 does (A), at the same time as Per1 does (B). Per1 oscillates in antiphase with Bmal1 (B). Asterisks on each curve denote points that are significantly different with each other after post-hoc comparisons. Note that the Bmal1-Per1 oscillations are out of phase with the same gene oscillations expected in the SCN. Representative AVPV radiomicrographs for each mRNA and time are shown (C).

