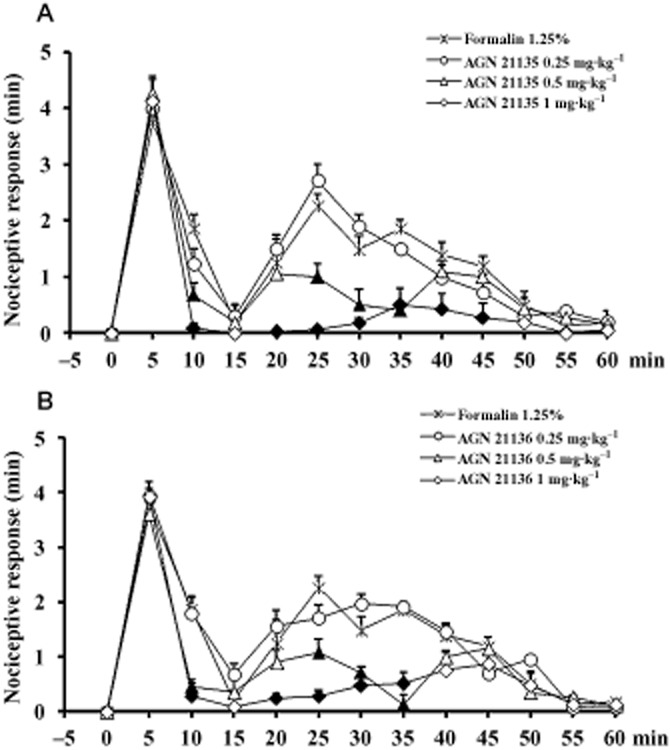
Figure 6.

Effect of AGN21135 and AGN 21136 (0.25, 0.5 and 1 mg·kg−1, i.p.) in the formalin model of pain in mice. The total time of the nociceptive response was measured every 5 min and expressed in min. Data are means ± SEM from six mice and were analysed by one-way anova followed by Newman–Keuls' post hoc test. Filled symbols denote statistically significant differences from values with formalin only (P < 0.05).
