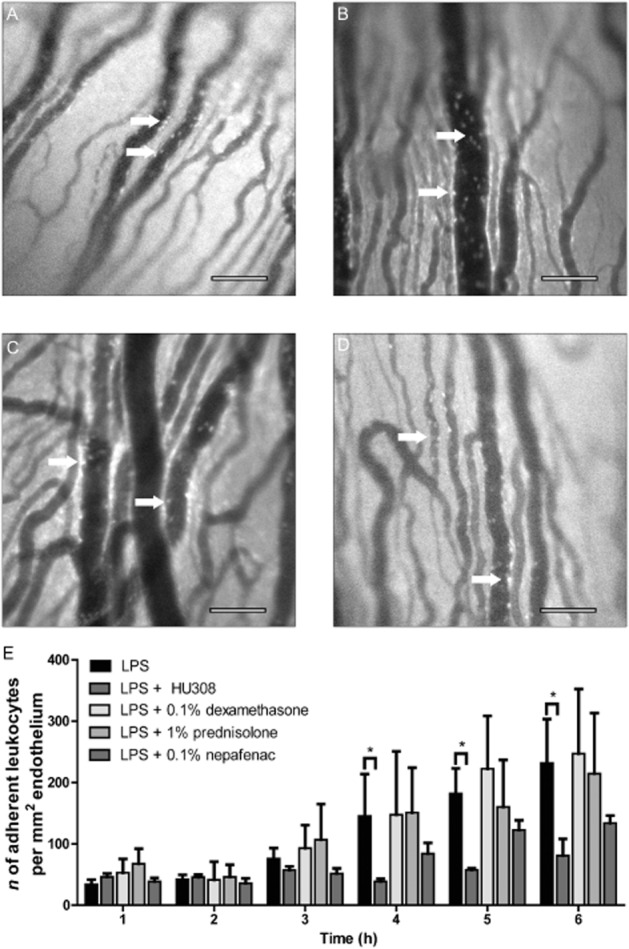
Figure 4.

(A–D) Representative intravital microscopy images of iridial microcirculation in rat eyes at 6 h after intravitreal LPS injection in the following groups: (A) LPS injection only (n = 15), (B) LPS + dexamethasone (0.1% topical), (C) prednisolone (1% topical) and (D) nepafenac (0.1% topical). Arrows indicate adherent leukocytes. Scale bar = 100 μm. (E) Bar graph represents the time course for the mean number of adherent leukocytes in the above treatment groups (n = 9 for all groups). Values represent mean ± SEM. *P < 0.05; compared with the LPS group.
