Figure 6.
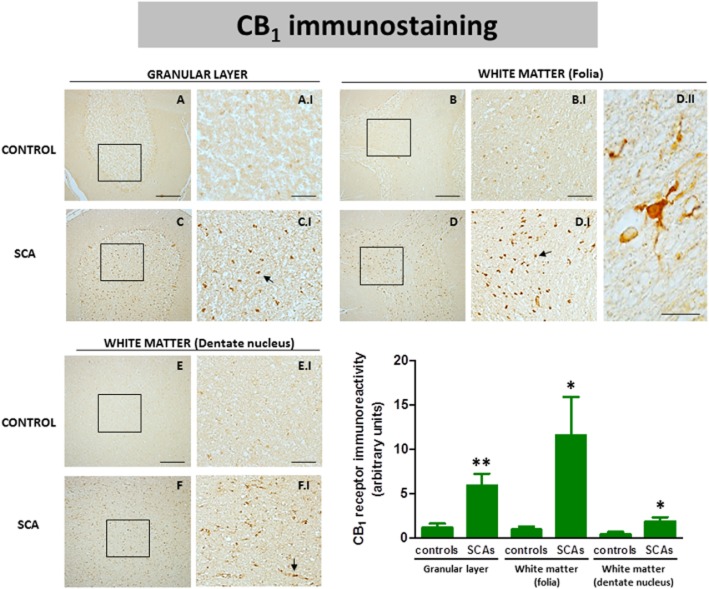
DAB immunostaining for the CB1 receptor in the granular layer and the white matter areas of the cerebellum of SCA patients (C, C.I, D, D.I, F and F.I) and control subjects (A, A.I, B, B.I, E and E.I). The arrows indicate the CB1 receptor-positive cells. The microphotograph shown in D.II corresponds to a detail of the CB1 receptor-positive cells in the white matter of the folia of SCA patients (scale bars: A–F = 200 μm; A.I-F.I = 50 μm; D.II = 10 μm). The microphotographs of SCA cases correspond to subject #9 (SCA7) for the granular layer and the white matter of the folia, and to subject #10 (SCA6) for the white matter surrounding the dentate nucleus. The bar panel corresponds to the quantification of CB1 receptor immunostaining in the three structures of SCA patients and control subjects. Values correspond to the mean density of labelling in a selected area and are expressed as means ± SEM of five subjects per group. Data were assessed by Student's t-test (*P < 0.05; **P < 0.01).

