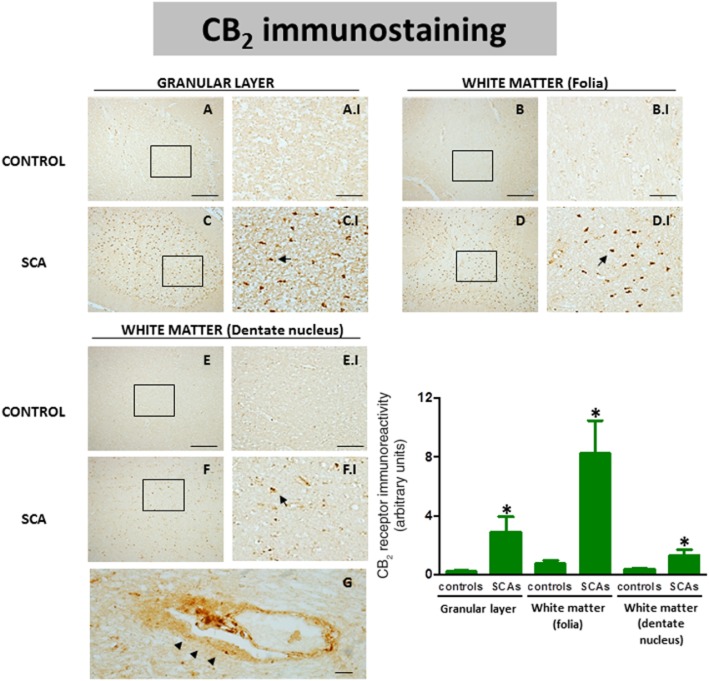
Figure 8.
DAB immunostaining for the CB2 receptor in the granular layer and the white matter areas of the cerebellum of SCA patients (C, C.I, D, D.I, F and F.I) and control subjects (A, A.I, B, B.I, E and E.I). The arrows indicate the CB2 receptor-positive cells. The microphotographs of SCA cases correspond to subject #10 (SCA6). The microphotograph shown in G represents a detail of the CB2 receptor-positive cells (marked with arrowheads) in perivascular zones of the white matter of SCA patients (scale bars: A–F = 200 μm; A.I-F.I = 50 μm; G = 10 μm). It corresponds to the subject #8 (SCA). The bar panel corresponds to the quantification of CB2 receptor immunostaining in the three structures of SCA patients and control subjects. Values correspond to the mean density of labelling in a selected area and are expressed as means ± SEM of five subjects per group. Data were assessed by the Student's t-test (*P < 0.05).

