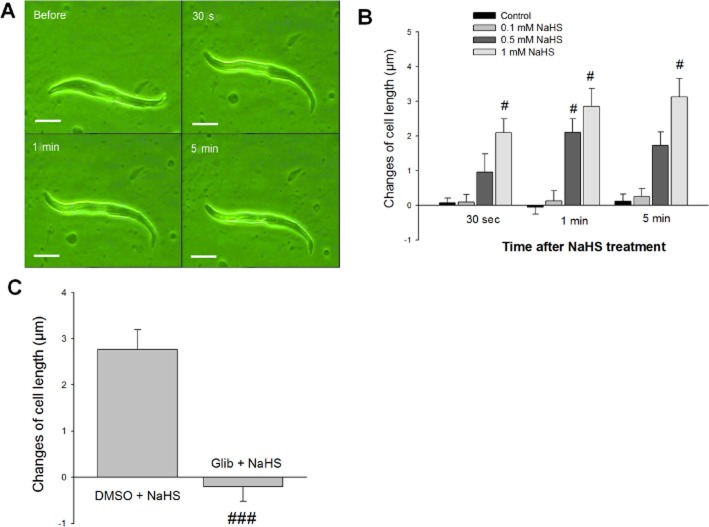
Figure 7.
Effects of NaHS on the isolated smooth muscle cells from rat duodenum. (A) A smooth muscle cell at different time points before and after treatment with NaHS (1 mM). The length of this smooth muscle cell was increased following NaHS administration. Scale bars are 25 μm. (B) The concentration-response and time course of the changes in cell length following NaHS administration. #P < 0.05 versus control. (C) The effects of Glib (10 μM) pretreatment on NaHS-induced relaxation of duodenal smooth muscle cells. ###P < 0.001 versus DMSO + NaHS.

