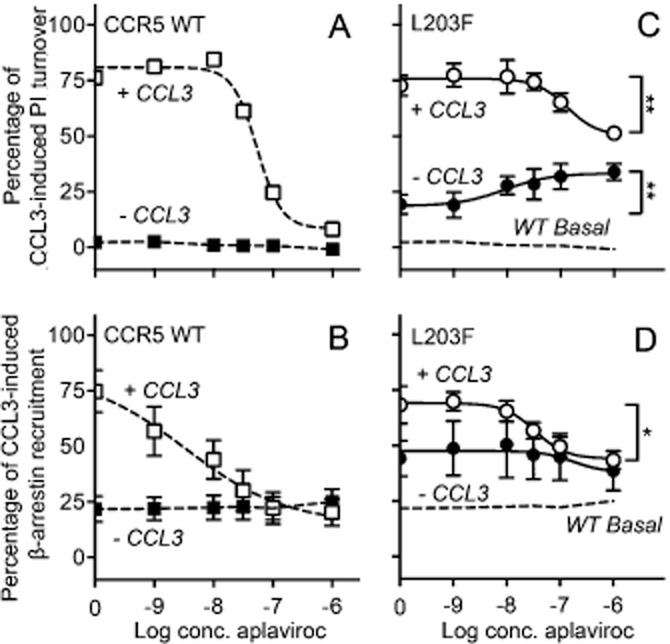
Figure 2.

Effect of aplaviroc on PI turnover and β-arrestin recruitment when acting on [L203F]-CCR5 and WT. The effect of aplaviroc was measured as G-protein signalling (PI turnover in COS-7 cells, A and C) and β-arrestin recruitment in U20S cells (B and D). The graphs represent CCR5 WT (A and B) and [L203F]-CCR5 (C and D) and are shown for aplaviroc with CCL3 and without CCL3. The data were normalized to Emax of CCL3 on the respective receptor. The basal level of activation for CCR5 WT is indicated with dashed lines on the graphs for the mutant (C and D). Statistical significance between untreated cells and cells treated with maximum concentration of aplaviroc was calculated using Student's unpaired t-test. *P < 0. 1, **P < 0.05, ***P < 0.001; ns, not significant; n = 4–13.
