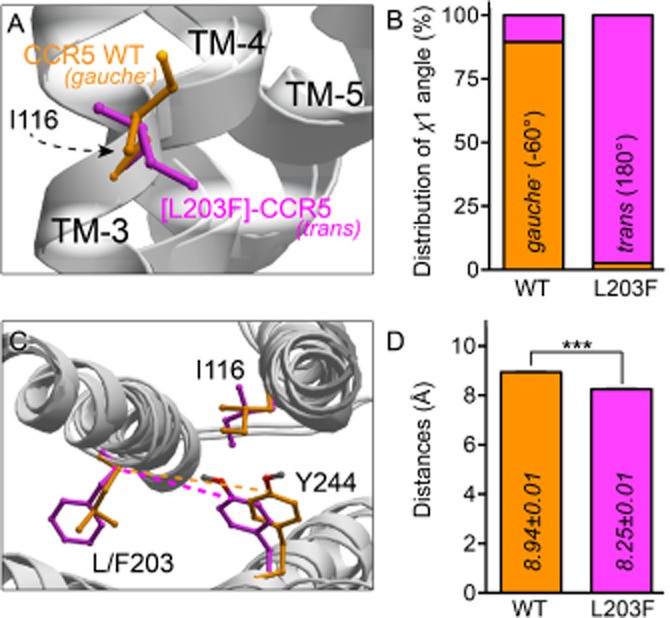
Figure 3.

Computational modelling of CCR5 WT and [L203F]-CCR5. In silico models of CCR5 WT (orange) and [L203F]-CCR5 (magenta). (A) Side view of the orientation of the χ1-angle of Ile116 and (B) the percentage distribution between gauche− (−60°) and trans (180°) measured in 1000 models of CCR5 WT and [L203F]-CCR5 respectively. (C) Top view of TM-3, TM-5 and TM-6 showing an example of the distance between Tyr244 and Leu/Phe203 (dashed lines emphasize the difference) for both WT and mutant receptor. (D) Mean distances between Tyr244 and Leu/Phe203 calculated for all 1000 models for each receptor. Statistical significance was calculated using Student's unpaired t-test. ***P < 0.001; n = 1000.
