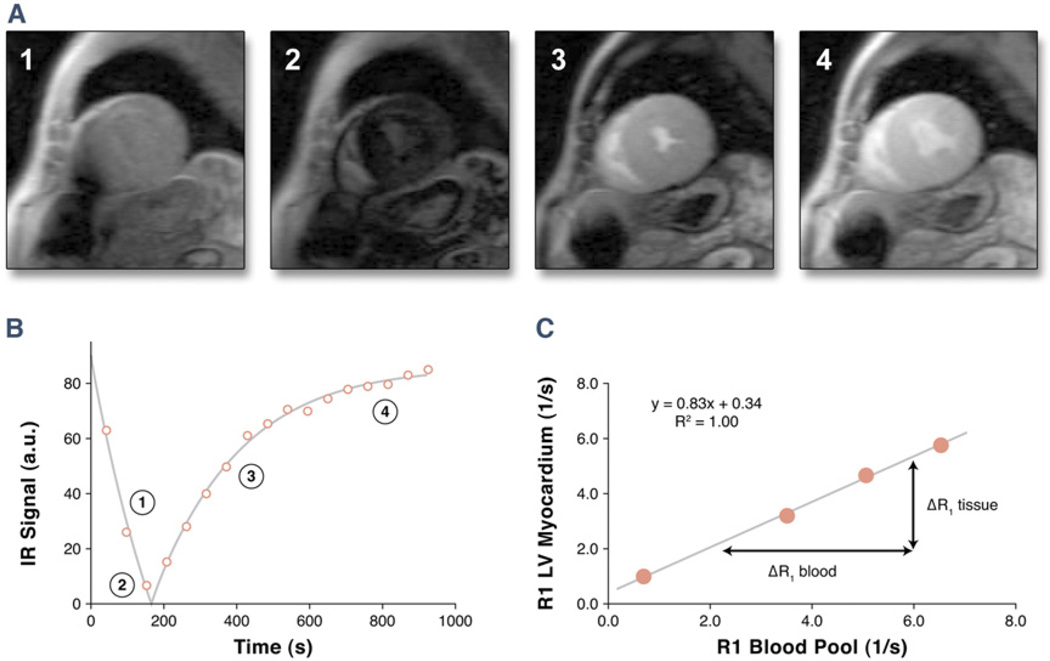
Figure 1. ECF Quantification.
The method of myocardial extracellular volume fraction (ECF) quantification by the Look-Locker gradient-echo sequence with an adiabatic inversion pulse is illustrated. (A) Images from the mid left ventricular (LV) short-axis location are shown (only 4 phases displayed). (B) Determination of T1 and R1 by exponential fitting of the signal-intensity versus time curve for 1 myocardial segment. Numbers correspond to signal intensities obtained at time points displayed in (A). (C) Derivation of the partition coefficient by calculating the slope of the linear relationship between R1 for myocardium versus R1 for the blood pool from all R1 measurements (0.83). Each corresponding point is derived from a signal intensity versus time curve as displayed in (B). The ECF is then determined by multiplying the partition coefficient by (1 hematocrit). IR inversion recovery.

