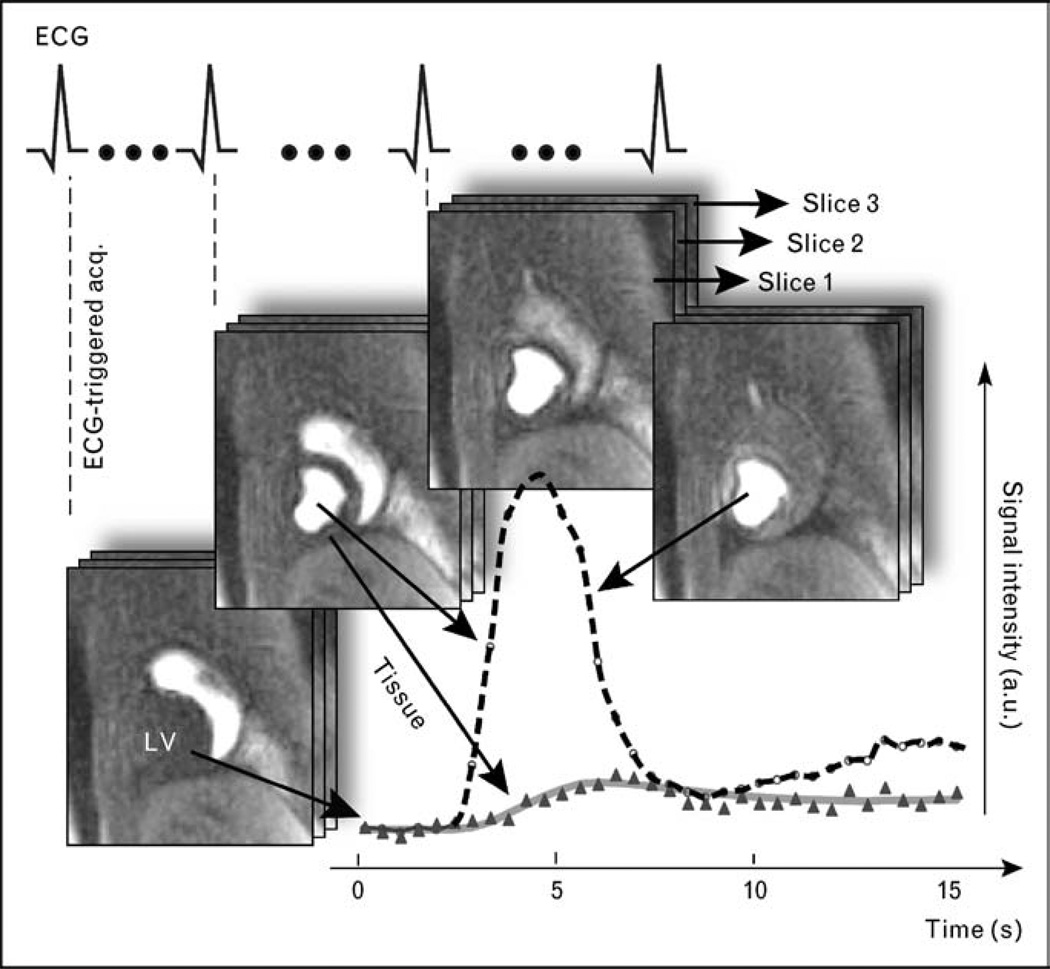
Figure 1. Schematic illustration of cardiac magnetic resonance data acquisition in myocardial perfusion imaging during the first-pass transit of a tight intravenous bolus injection of gadolinium-based contrast agent.
Images are acquired with an electrocardiogram-triggered, multislice imaging protocol, for example, in the short-axis orientation as in this example, and at a rate equal to the heart rate, to achieve adequate temporal resolution. A visual or quantitative analysis of the signal intensity changes in the myocardium allows the identification of hypoperfused areas. The signal intensity changes shown in the graph of this figure were determined for a myocardial region and a region in the center of the left ventricle (LV), with the latter serving as arterial reference or input function. For a quantitative analysis, this arterial input is used as ‘reference’ for analysis of the myocardial enhancement.

