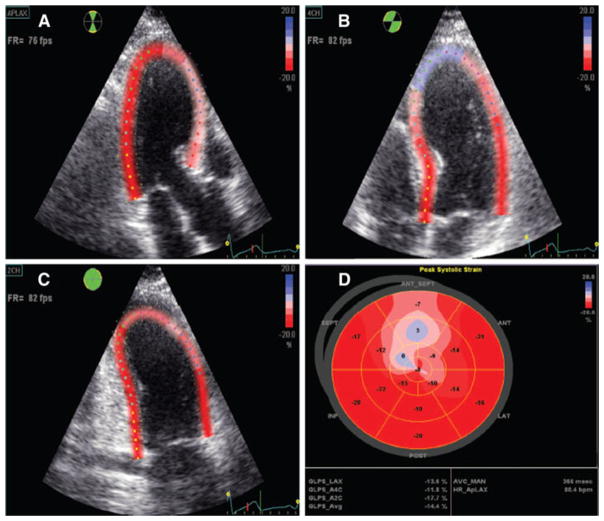
Fig. 3.
Echocardiographic assessment of global strain using speckle tracking technology to assess myocardial viability. Normal strain is represented in red; decreased (less negative) strain is represented in blue. In this patient, after an acute anteroseptal myocardial infarction, the amount of strain is decreased in the anteroseptal segments of the left ventricle (apical long axis views) consistent with a region of infarction. In addition, global left ventricular strain (polar plot) is decreased (GLPS_Avg −14.4%; normal values range from −20.3 to −24.1%). Images reproduced with permission from Mollema et al. [13]

