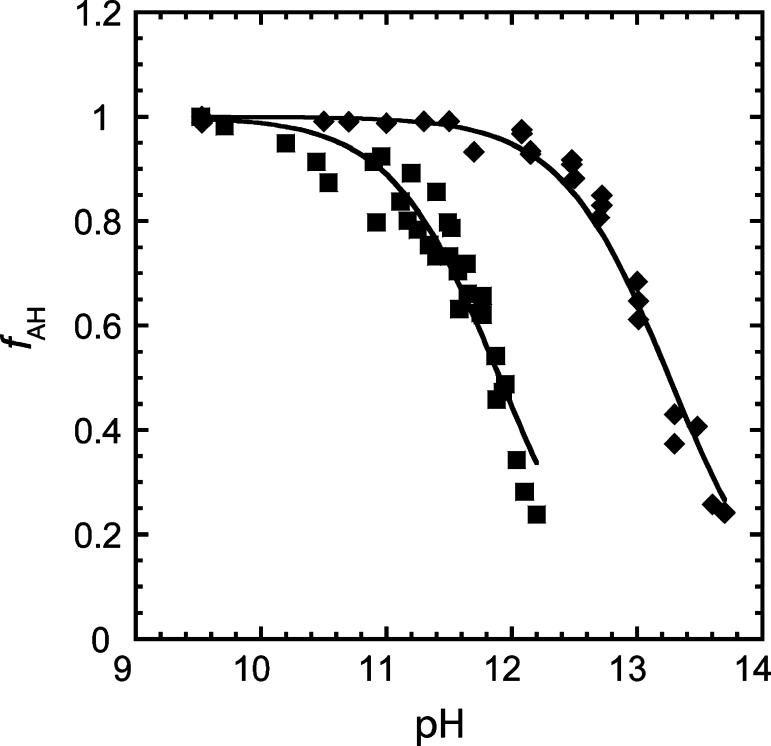
Figure 10.
Fraction of protonated species as a function of pH in the presence of 0.5 M Na+ (◆) and 10 mM Ca2+ (■) as determined by the NMR method. The fraction of protonated species at a given pH was generated using eq 6. The pKa values were determined by fitting δobs vs pH plots to eq 4, as shown in Figure S9 in the Supporting Information, and were found to be 13.2 and 11.9 in the presence of 0.5 M Na+ and 10 mM Ca2+, respectively.

