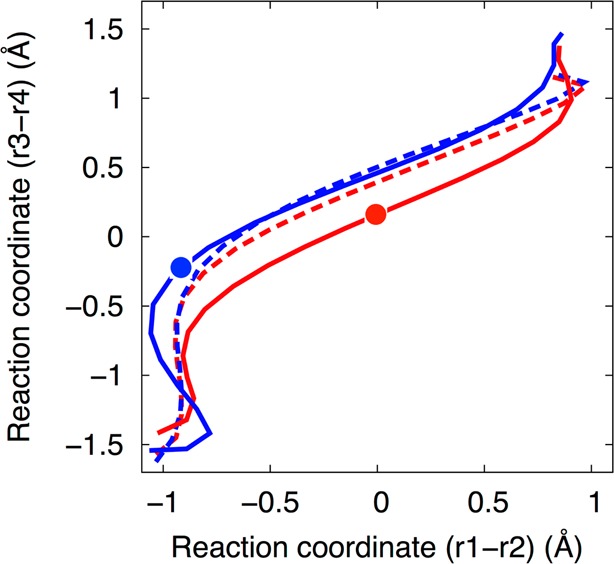
Figure 6.

The initial (dashed lines) and final (solid lines) strings from sets C (red, Mg2+ at the catalytic site) and D (blue, Na+ at the catalytic site). The results for set C (both the solid and dashed red lines) are reproduced from Figure 3. The strings are projected in the space of the collective coordinates (r1 – r2) and (r3 – r4). The converged string from set D is distinct from the converged string from set C. The red circle indicates the position of the phosphorane-like transition state structure (free energy maximum for the concerted mechanism with Mg2+), while the blue circle indicates the position of the phosphorane intermediate structure (free energy minimum for the sequential mechanism with Na+).
