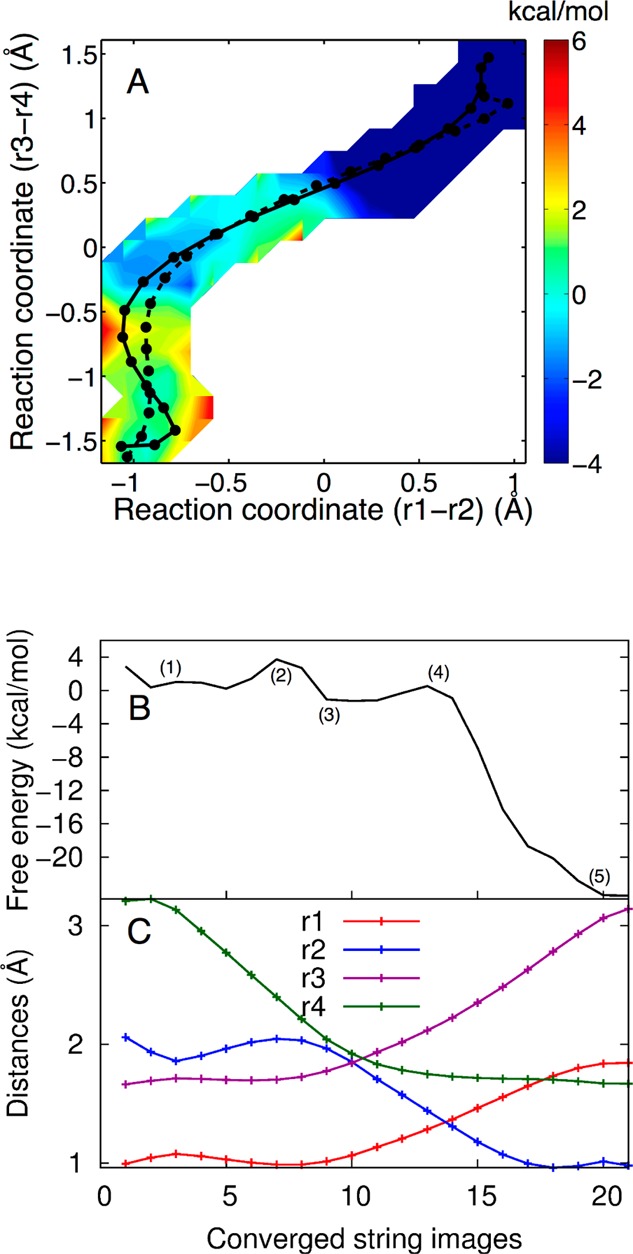
Figure 7.

(A) The 2D free energy surface obtained from simulation set D, where a Na+ ion is at the catalytic site, projected in the (r1 – r2) and (r3 – r4) space. The initial and converged strings are illustrated on the surface as the dashed and solid black lines, respectively. In this case, the MFEP (solid black line) is sequential, passing through a phosphorane intermediate. Each circle corresponds to an image along the string. The color scale denotes free energy in units of kcal/mol. (B) The 1D free energy profile along the MFEP obtained from set D, where a Na+ ion is at the catalytic site. (C) Values of the most important reaction coordinates, r1, r2, r3, and r4, along the MFEP. Each circle corresponds to an image along the string.
