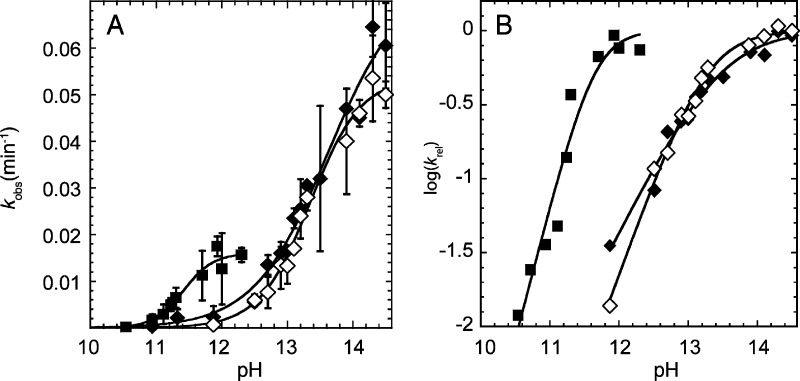
Figure 9.
Determination of the pKa of the 2′-OH by the kinetic method. (A) Plot of kobs as a function of pH in the presence of 3.16 M Na+ (◆), 3.16 M K+ (◇), and 10 mM Ca2+ (■). (B) Plot of log(krel) as a function of pH using the same symbols as in panel A. krel was obtained by normalizing the data in panel A to the kmax value from the fit. The pKa values were determined by fitting the rate versus pH plots in panel A to eq 3 and were found to be 13.6, 13.3, and 11.4 in the presence of 3.16 M Na+, 3.16 M K+, and 10 mM Ca2+, respectively. (Note that for panel A, the pKa is the pH where kobs = kmax/2, while for panel B the pKa is the pH near the flex point.) The Hill coefficients determined from the fits of the data in panel A to eq 3 were found to be 0.8, 1.1, and 1.9 for Na+, K+, and Ca2+, respectively. These Hill coefficients are apparent in the relative slopes in panel B. The value of kmax is ∼3-fold higher for monovalent ions than divalent ions, as revealed in panel A, but the pKa values are unaffected by kmax differences as they are determined entirely from the shape of the curves. The origin of the kmax difference is unclear, but this difference could reflect different interactions of divalent and monovalent ions with this 22-mer.

