
Figure 3.
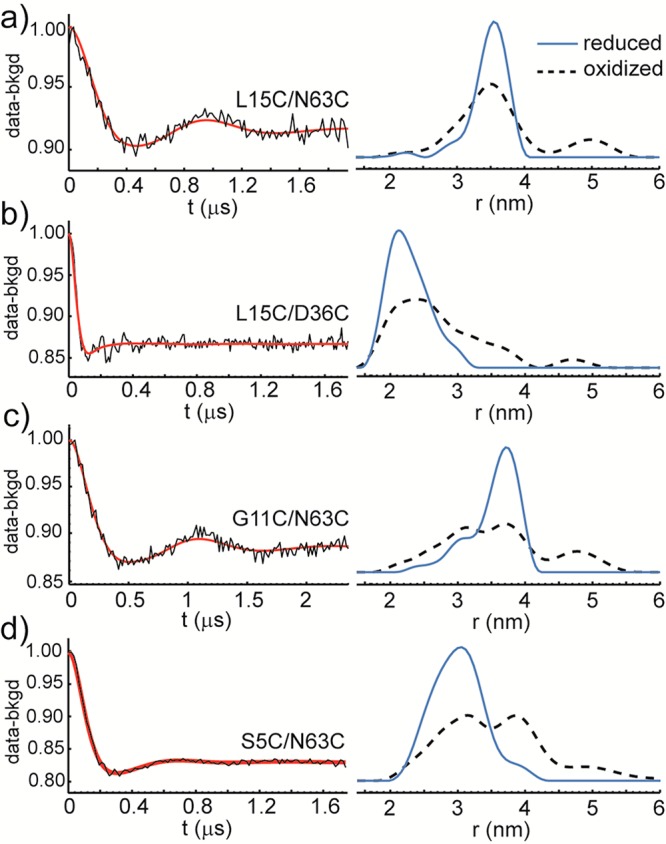
X-band DEER of spin-labeled MMOB double cysteine mutants in the Hred–2B complex and the corresponding core-to-tail distance distributions. Left panels, background subtracted DEER data (black) and simulated fits (red) for spin-labeled MMOB double mutants L15C/N63C, L15C/D36C, G11C/N63C, and S5C/N63C in the Hred–2B complex. Right panels, the corresponding distance distributions derived from the DEER data (blue); the DEER derived distance distributions of the corresponding Hox–2B complex are also shown (black dashed lines). DEER data were processed by using DeerAnalysis 2011.16 The distance distributions derived from the crystal structure were modeled by using MMM program package 2011.2.17