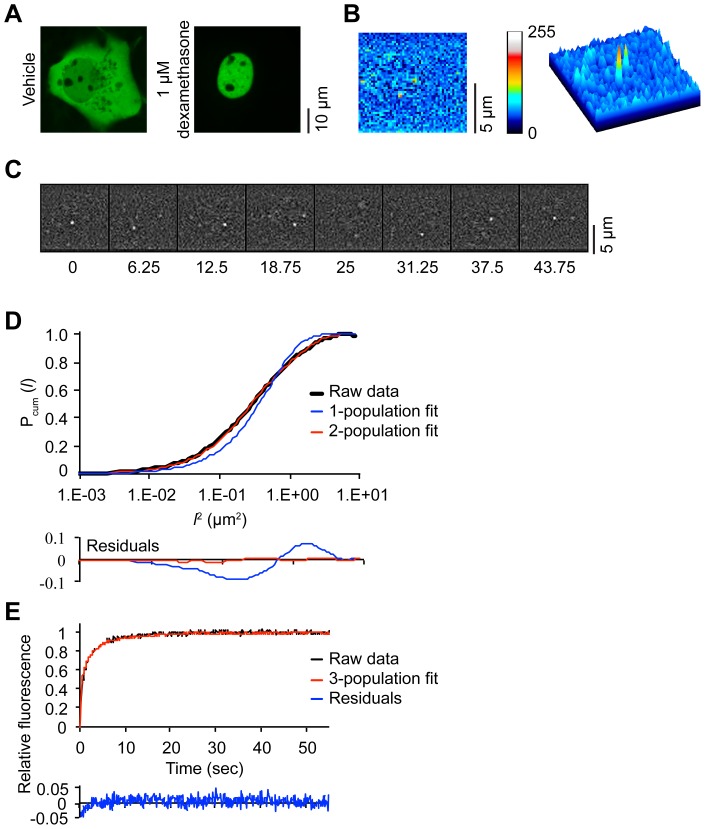
Figure 1. SMM and FRAP procedures.
(A) Representative confocal images show complete nuclear translocation of YFP-GR after 3 hours of 1 µM dexamethasone treatment. (B) A representative CCD image of single molecules of YFP-GR after background subtraction shows two discernible Gaussian peaks of YFP fluorescence. (C) Regime for single molecule kinetics; images are taken with a time lag of 6.25 ms or 12.5 ms in 300 series of 8 per cell. In background-subtracted images, single molecules of YFP fluorescence are easily discernible. (D). PICS analysis of single molecule displacements, shown for dexamethasone-bound YFP-GR at time delay of 6.25 ms. The cumulative probability distribution as a function of the squared distance l (black line) is best fitted with a 2-population model (red dashed line), while a 1-population model gives a suboptimal fit (blue line) (n = 20 cells). (E) FRAP procedure of dexamethasone-bound YFP-GR. At t = 0 s a 100 ms bleach pulse is applied to a strip spanning the nucleus. Subsequently, FRAP recovery curves of 30 cells are recorded, combined and adjusted to baseline fluorescence (black line). Subsequently, Monte Carlo simulations are generated using a 3-population model and fitted to the combined FRAP curve. The top 10 fits are combined (red line) and show a good fit of the experimental data with small residuals (blue line).

