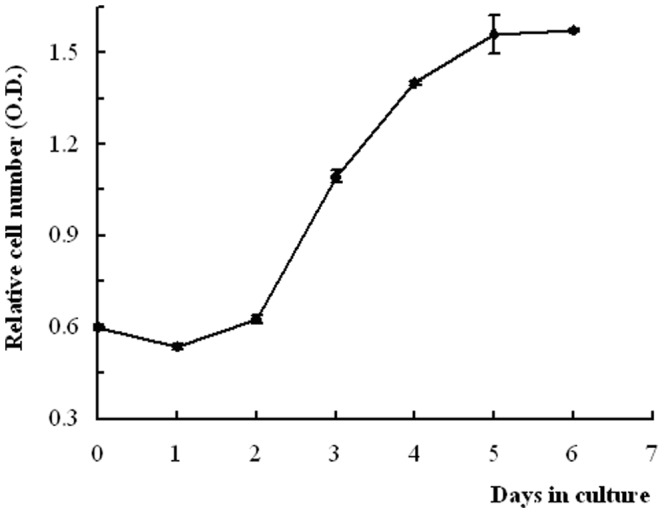
Figure 4. Growth curve of OECs in culture.

The log phase started after day 2 of the lag phase with a sharper inclination and cells entering the logarithmic growth phase on day 5. N = 4.

The log phase started after day 2 of the lag phase with a sharper inclination and cells entering the logarithmic growth phase on day 5. N = 4.