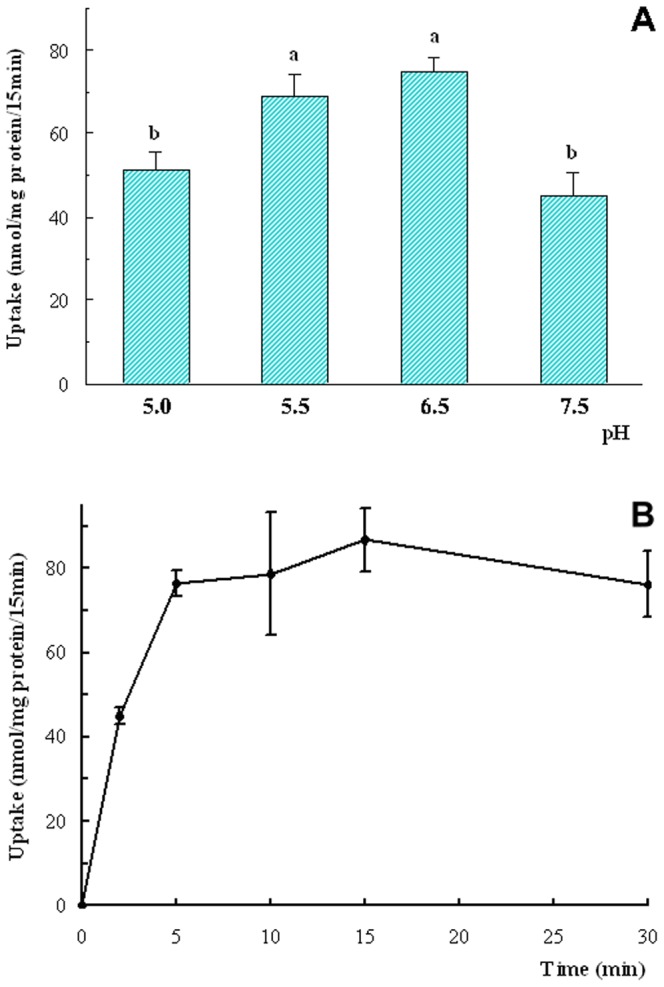
Figure 8. The effects of pH and time on Gly-Sar uptake by OECs.

A: Uptake of Gly-Sar at various pHs for 15 min. B: The uptake of Gly-Sar at various time points (min) under pH 6.5. N = 4. Values with different letter (a, b) indicate significant difference (P<0.05).
