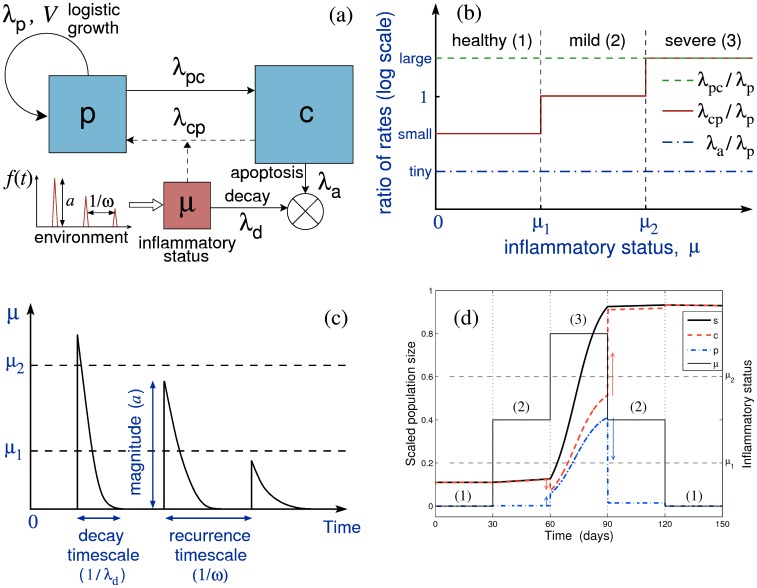
Figure 2. A schematic of the model design.
(a) Schematic representation of the model with p being the amount of ASM cells in proliferating state, c the amount of non-proliferative cells and μ the inflammatory status; λp is the proliferation rate, λa is the apoptosis rate, λcp and λpc are the switching rates between non-proliferative and proliferative states, λd is the inflammation clearance rate, and f(t) is a time-dependent external inflammatory stimulus. (b) Dependence of the model parameters on the inflammatory status μ (three levels of inflammation are characterised by the thresholds μ1 and μ2; see Table 1 for reference values). Rates are plotted on a logarithmic vertical scale. (c) An illustration of the inflammatory status dynamics induced by a series of environmental stimuli such as shown in (a), illustrating graphically the parameters λd, a, and ω. (d) A simulation of the ASM cell population response (p, blue dash-dotted; c, red dashed; s = p+c, thick black solid) to a stepwise variation in the inflammation status (thin solid); the arrows show the direction of change in the ASM subpopulations. Although the inflammatory status returns to its initial state at the end of the simulation, the total ASM cell population has irreversibly increased, showing thereby “effective” hysteresis. Only the time spent in “severe” regime (μ>μ2) contributes to substantial growth (over weeks); however, the “moderate” regime (μ1<μ<μ2) can also give rise to substantial growth over a longer timescale (months). Note that the proportion of proliferative cells (blue dash-dotted) is significant only during the “severe inflammation” regime (3).

