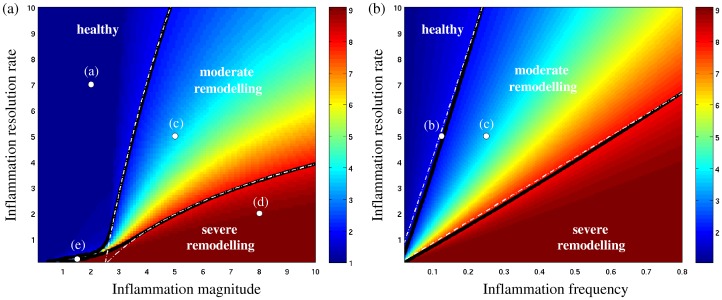
Figure 4. Survey of ASM growth scenarios, showing fold-increase in ASM population size after 300 days (colour scale) as a function of the inflammation resolution rate IR = λd/λp and (a) inflammation magnitude a/μ1 (for fixed frequency ω/λp = 0.25) or (b) inflammation frequency ω/λp (for fixed magnitude a/μ1 = 5).
White dots indicate the growth regimes shown in Fig. 2. Solid black lines are the computed isolines of the 2- and 8-fold ASM growth, which agree with the theoretically predicted dependence λd ∼ ω log a/μ2 (dashed white lines; see Materials S1).

