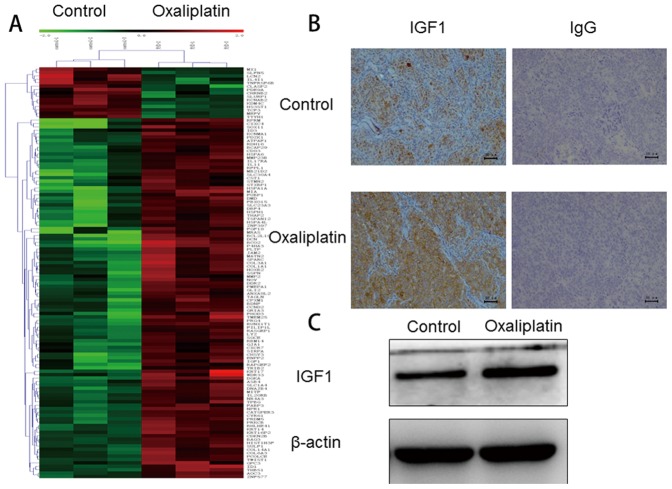
Figure 3. Gene expression profiles of tumor tissues from oxaliplatin-treated and GS-treated s.c. tumor (control).
(A) 332 genes had more than 2-fold differences between oxaliplatin-treated and GS-treated s.c. tumor. (B) Immunohistochemical analysis revealed up-regulated expression of IGF1 in tumors from oxaliplatin-treated s.c. tumor, IgG were negative control groups, the cytoplasm of positive cells were brownish, original magnification×200. (C) Western blot analysis showed up-regulated expression of IGF1 in tumors from oxaliplatin-treated s.c. tumor.

