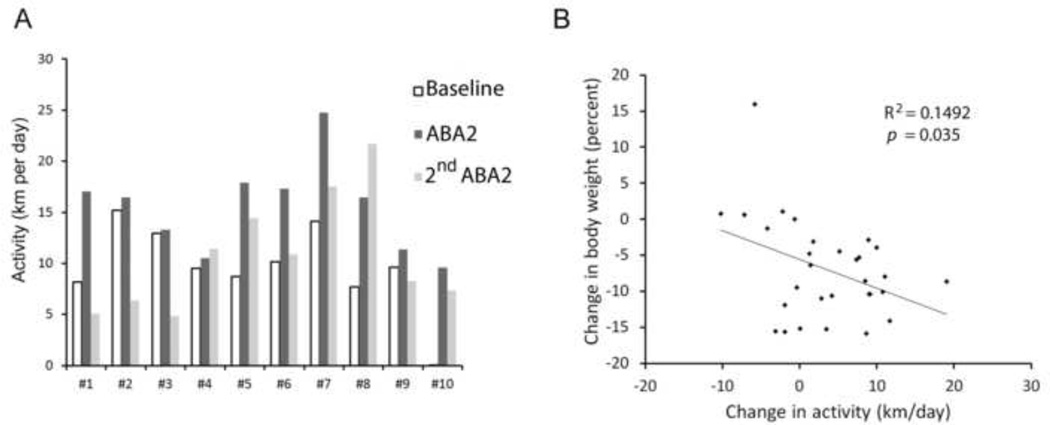
Figure 4. Individual differences in vulnerability to ABA2.
Panel A. Data from the same ten animals, shown in Figure 3, are presented here to depict individual differences. Animals #1 through #5 were littermates of a G42 genotype, animals #6 through #8 were littermates of the GIN genotype and animals #9 and #10 were WT littermates. All were on a C57BL/6J background. Animals varied in their baseline wheel activity but all exhibited increased activity in response to the first ABA2. The degree of change in activity fell into two groups, with some exhibiting an increase that was greater than 7 km per day, and the remaining animals exhibiting an increase that was modest (less than 2 km per day). Differences in their responses were observed within single litters. The animals’ responses to the second ABA2 schedule were variable, with most animals exhibiting less hyperactivity than after the first ABA2, four of them less activity than of its baseline level, and Animal 8 being the only one to exhibit more hyperactivity following the second exposure to ABA2. Panel B. Mice that underwent the ABA2 schedule exhibited a range of hyperactivity responses. For all ten animals, the change in body weight, relative to the previous day’s weight was compared against the change in wheel running activity, relative to the level of activity on the day before FR. This analysis was run for data collected during the first exposure to ABA2. Thus, three data points are represented for each of ten animals, representing the changes in body weight and activity across the three days of exposure to the first FR. R2 and p-values were determined, based on a multiple regression analysis. This analysis revealed that increased wheel running activity correlates with a reduction of body weight on that day.

