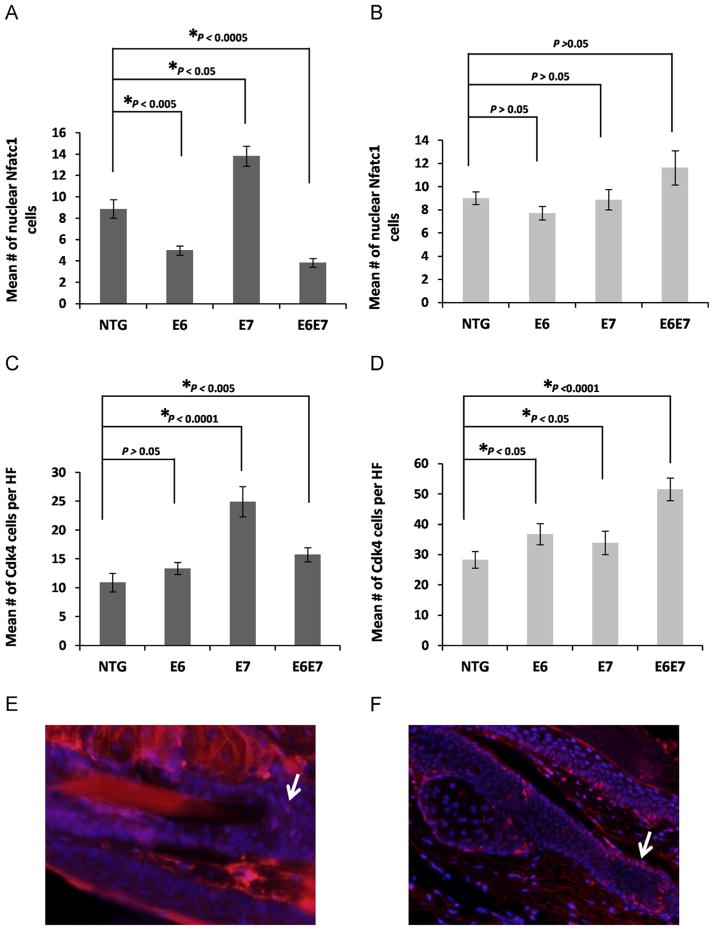
Fig. 5. The quiescence of the bulge stem cell population is affected upstream as well as downstream of the Nfatc1 pathway by HPV16 oncogene expression.
(A–D) ~50 Hair follicles were selected from at least 3 mice of each genotype, NTG, E6, E7 and E6E7 mice. The mean number of Nfatc1 (A,B) and Cdk4 (C,D) positive cells of each hair follicle in telogen (no TPA) (A,C) and anagen (TPA) (B,D) conditions was quantified and plotted for each genotype (columns); bars, SD. All statistical comparisons were performed using a two-sided Wilcoxon rank sum test. (E,F) Representative immunofluorescense staining of (E) nuclear Nfatc1 and (F) Cdk4 positive cells is depicted by arrows. Counterstaining was done with DAPI (blue).

