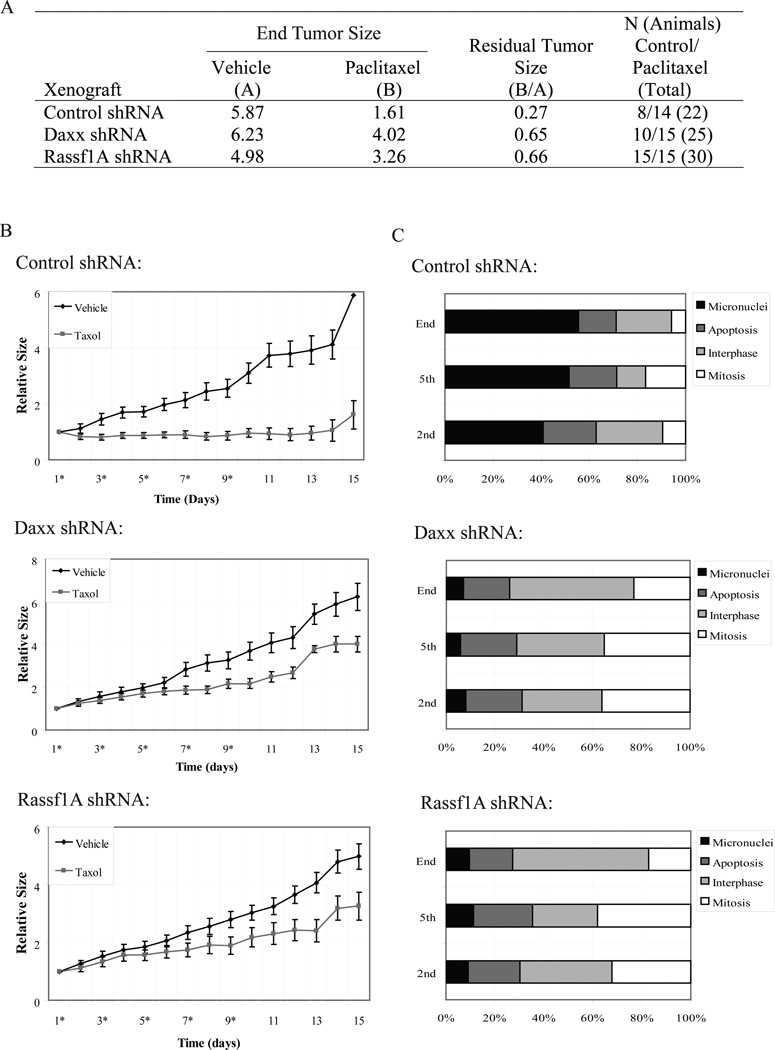
Figure 6. Depletion of Daxx or Rassf1 increases resistance of experimental tumors to taxol.
Control-, Daxx- or Rassf1A-depleted tumors derived from injection of HEp2 cells into Nu/Nu mice were treated with vehicle or 20mg/kg taxol. A) Table summarizing key statistical data generated from tumors exposed to vehicle or taxol regimens. Relative tumor sizes for vehicle (A) or taxol-treated tumors (B) were recorded at the end of treatment and the relative residual tumor volumes were calculated by dividing the values from (B) over (A). B) Graphs charting the changes in relative tumor size of control-, Daxx- or Rassf1A-depleted xenografts exposed to vehicle or taxol. Asterisks at day number (x axis) denote time of injection of vehicle or taxol (days 1, 3, 5, 7, 9). Note discrepancy in tumor growth in vehicle and taxol treated tumors in control shRNA groups, while the rate of growth in Daxx- and Rassf1A-shRNA groups exposed to taxol have reduced response. C) Treatment response at cellular level. Tumor xenografts were extracted 24 hours following the 2nd or 5th taxol injection or at the end of experiment (day 15) and cellular response was analyzed based on appearance of chromatin (stained for DNA) by light microscopy and characterized as 1) interphase, 2) mitotic, 3) micronucleated, and 4) apoptotic as described previously (Lindsay et al., 2007). Control xenografts exhibited an increased number of micronucleated cells (indication of taxol response), while Daxx and Rassf1A-depleted xenografts show increased numbers of mitotic and interphase cells (indication of taxol resistance and continuous proliferation) and correspondingly less micronuclei; number apoptotic cells is similar in all groups.

