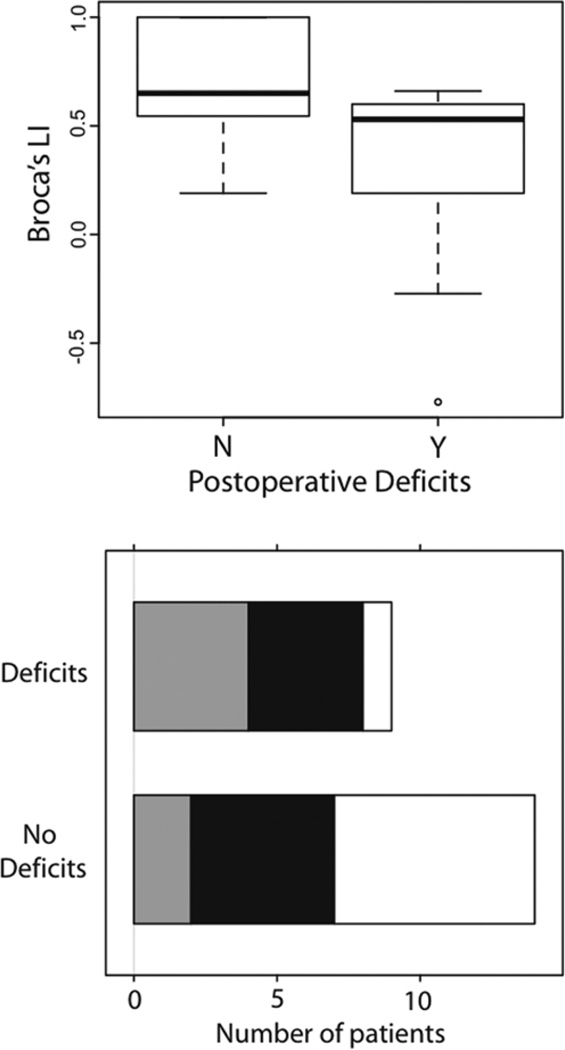
Fig. 3.
Frequency histograms of patients with and without postoperative deficits (aphasia). Functional MRI measures related to postoperative language deficits in the patient group with posterior brain tumors. Upper: Broca area LI versus presence of postoperative deficits. Lower: Wernicke area LAD categorized as < 1 cm (gray), 1–2 cm (black), and > 2 cm (white).

