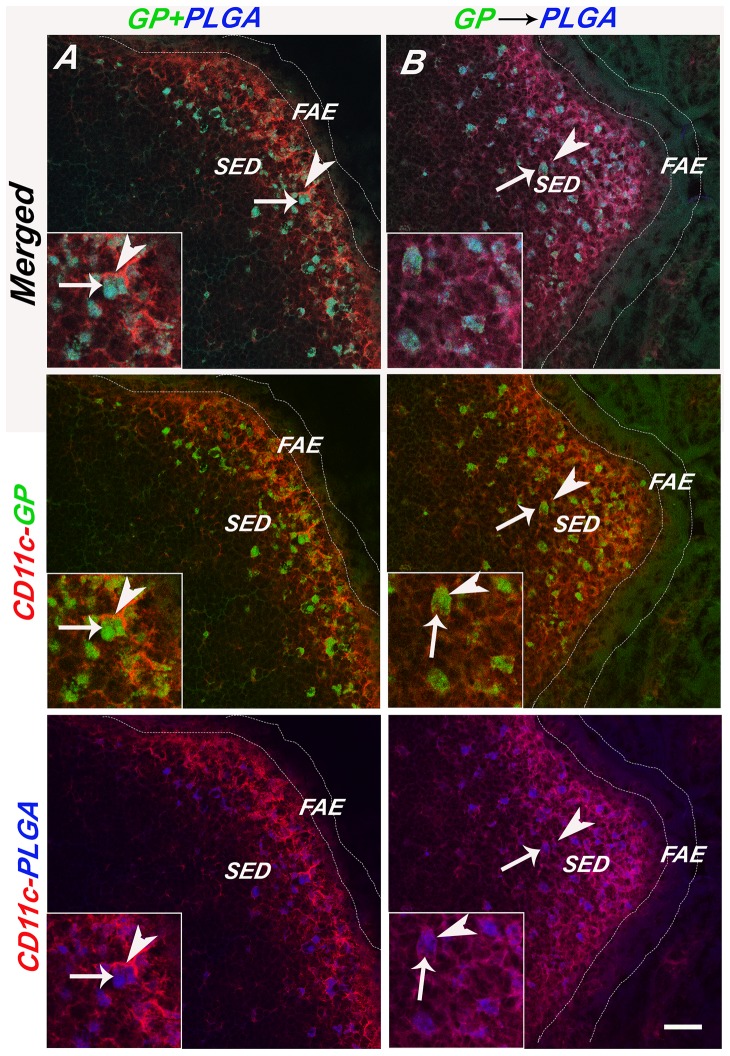
Figure 5. Sampling of GP and PLGA microspheres by SED DCs.
PLGA microspheres (blue) were either (Panel A) co-gavaged with FITC-GPs (PLGA+GP) or (Panel B) administered to mice 1 hr after FITC-GPs (PLGA>GP). Twenty-four hours later PP were collected, cryosectioned, immunostained for CD11c (arrowheads; red) and viewed by confocal laser scanning microscopy. Selected GPs are noted with an arrow. The top pair of panels is a merge of the FITC, APC and PE channels, the middle panels are red and green, and the bottom red and blue, as indicated by the vertical annotation on right. Scale bar corresponds to 100 μm.

