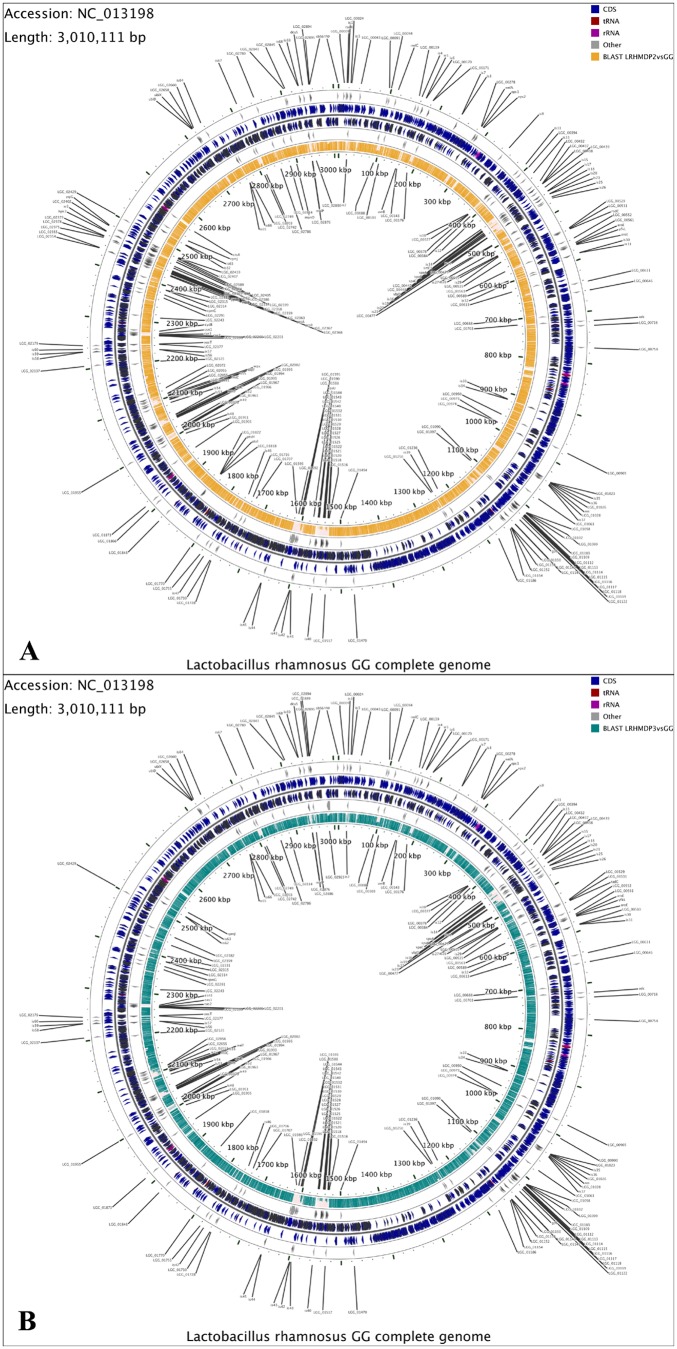
Figure 1. (A) Difference in gene content between L. rhamnosus GG and L. rhamnosus LRHMDP2; (B) Difference in gene content between L. rhamnosus GG and L. rhamnosus LRHMDP3.
In both figures, genes from positive and negative strands of L. rhamnosus GG are shown in rings II and III (from outside). Protein coding genes, tRNA and rRNA genes are shown by different colours. Directions of the arrows indicate the translational directions. Genes found to be absent in L.rhamnosus LRHMDP2/LRHMDP3 are highlighted in rings I and IV, and are labelled using gene symbols. The innermost rings (V) represent the homology of L.rhamnosus LRHMDP2/LRHMPD3 against L. rhamnosus GG, regions. Gaps indicate lower BLAST scores between the genomes of L. rhamnosus LRHMDP2/LRHMDP3 and L. rhamnosus GG [48].

