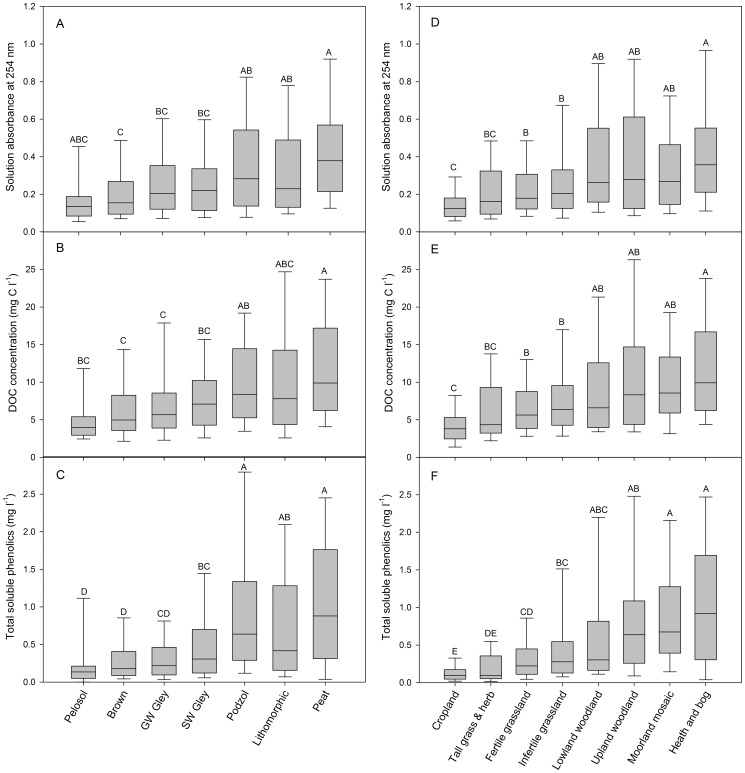
Figure 2. Box plots showing the influence of soil class (panels A–C) and vegetation cover type (panels D–F) on the absorbance of soil solutions at 254 nm, their DOC and total soluble phenolic concentration from 702 individual soils sampled as part of a nationwide soil quality assessment.
The boundary of the box closest to zero indicates the 25th percentile, the line within the box marks the median, and the boundary of the box farthest from zero indicates the 75th percentile. Whiskers (error bars) above and below the box indicate the 90th and 10th percentiles respectively. Different letters indicate significant difference between individual groups (P<0.05). Soils are ranked in organic matter (OM) content from left (low OM) to right (high OM) while vegetation is broadly ranked according to agricultural productivity.

