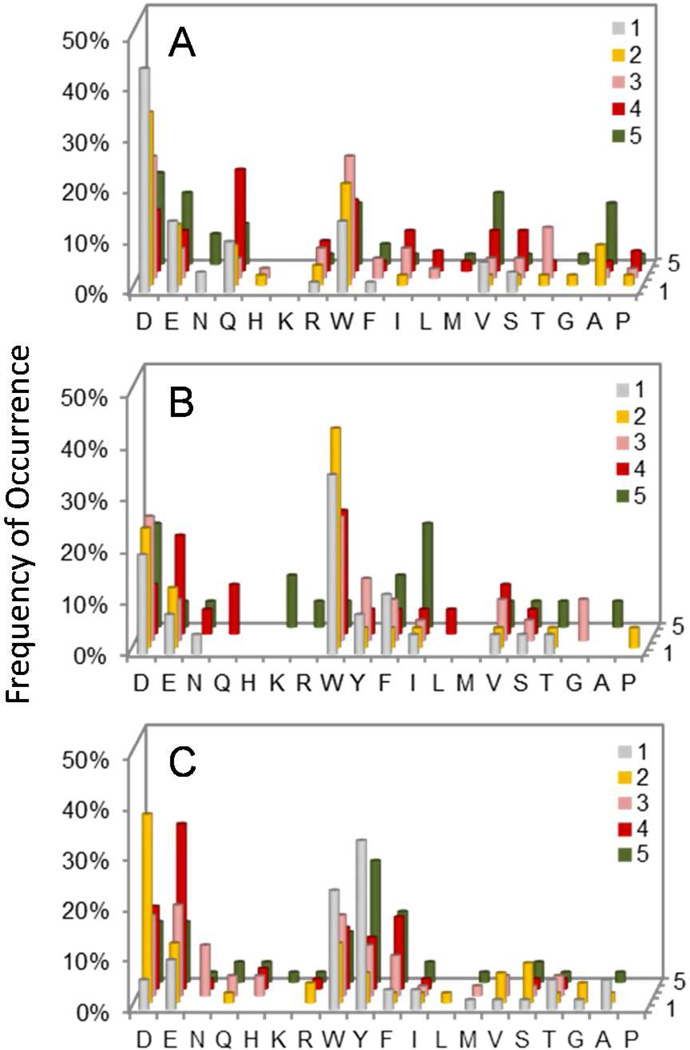
Figure 2.
Histograms showing the C-terminal selectivity of HePTP (A), TCPTP/Class I (B), and PTPD2/Class I (C) derived from Library IV. The y axis represents the percentage of selected peptides that contained a particular amino acid (x axis) at a given position within the peptide (pY+1 to pY+5, on the z axis). M, Nle; Y, F2Y.

