
Figure 4.
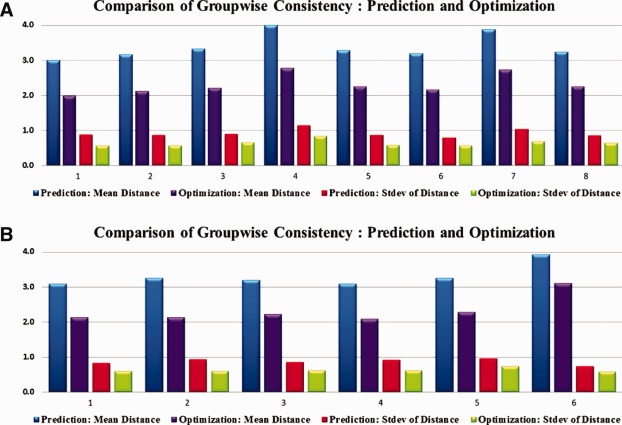
Groupwise consistency comparison for DICCCOL‐PCE ROIs. (a) PCE subjects. The average trace‐map distance drops by 31.8% after optimization and the standard deviation drops by 30.1%. (b) Control subjects. The average trace‐map distance drops by 29.8% after optimization and the standard deviation drops by 27.7%. [Color figure can be viewed in the online issue, which is available at http://wileyonlinelibrary.com.]