
Figure 8.
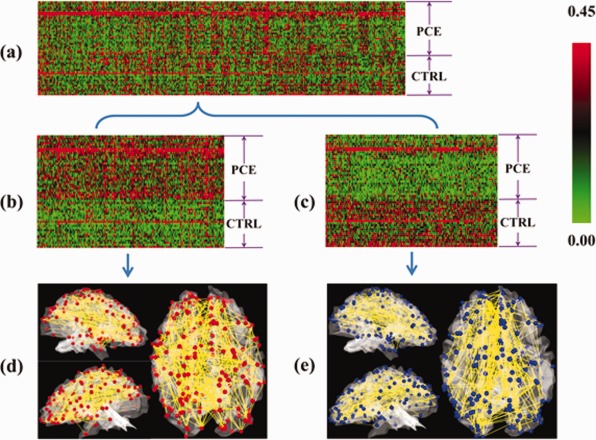
Connectomics signatures for characterization of PCE. (a) Each connectome is represented by a row of 845 connections (selected from 60,378 connections via t test, P‐value = 0.005) and each column stands for 29 PCE and 22 control subjects. Red and green stand for hyper‐ and hypo‐connectivities. Two connectomics signatures were discovered, as shown in more details in (b) and (c). The spatial distributions of these connectomics signatures on the cortical surfaces are provided in (d) and (e). [Color figure can be viewed in the online issue, which is available at http://wileyonlinelibrary.com.]