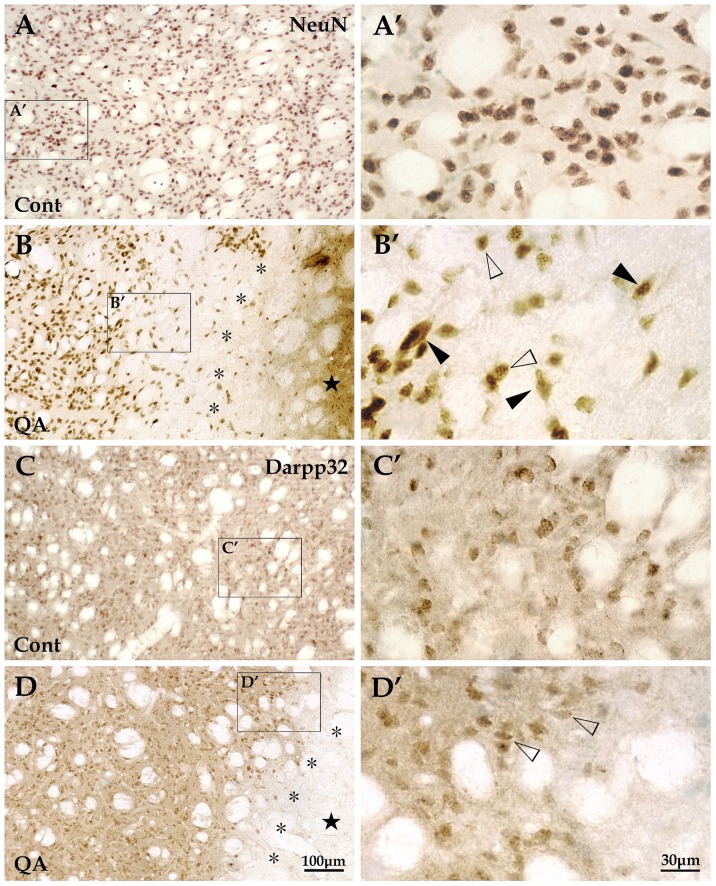
Figure 4. Changes of striatal projection neurons induced by QA.
Striatal neurons, presented with NeuN labeling, were evenly distributed throughout the striatum in the control group (A and A′) while the NeuN+ cells in the QA group (B and B′) were extremely scarce in the lesion core (★) and notably reduced in quantity in the transition zone (*). Those neurons survived in the transition zone (B′) included some medium-sized neurons (white arrowheads) and a few large-sized neurons (black arrowheads). Striatal projection neurons, labeled for Darpp32, were medium in size and evenly distributed in the striatum in control rats (C and C′). The Darpp32+ projection neurons hardly survived in the lesion core and only a small proportion did in the transition zone (D and D′). Cont is short for control. Panels A′–D′ are views of higher magnification from the boxes of Panels A–D, respectively. Scale bars: A–D, 100 μm; A′–D′, 30 μm.

