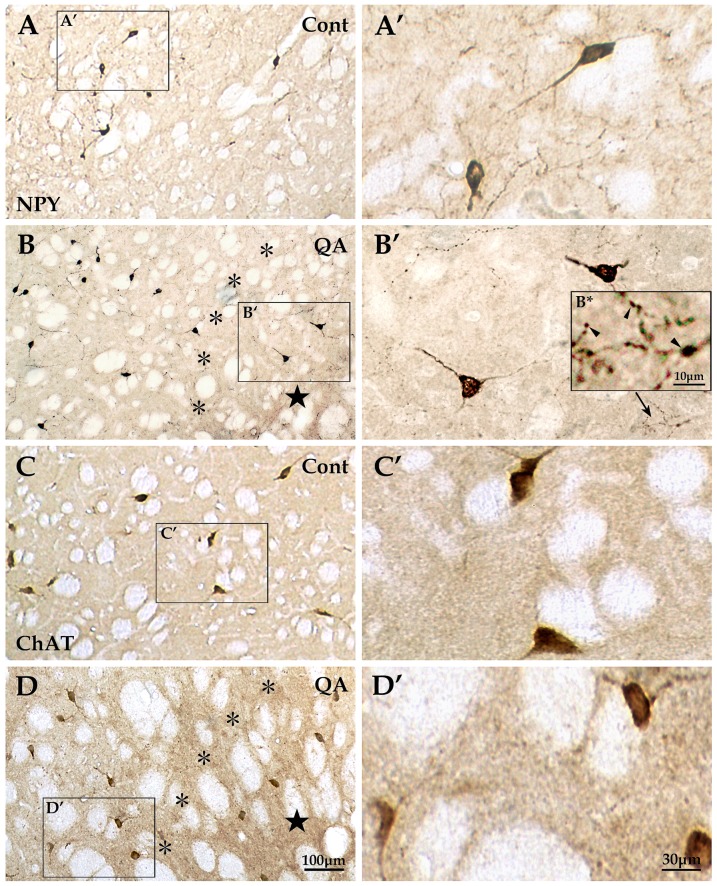
Figure 6. Reactions of NPY+ and ChAT+ interneurons to QA.
The NPY+ interneurons were evenly distributed in the striatum in the control group (A and A′). This interneuron type in QA-treated rats (B and B′) hardly survived in the lesion core (★) and experienced some changes in the transition zone (*) including decrease in neuron number and increase in the number of varicosities which formed along the neuronal processes (see the arrow in B′ and the view of higher magnification in B*), but hyperplasia of fibers was not obvious. The ChAT+ interneurons were large in size and evenly distributed throughout the striatum in the control rats (C and C′) and they appeared stable in neuron abundance as well as in morphology without hyperplasia of fibers or varicosity formation in the QA-treated rats (D and D′). Panels A′–D′ are views of higher magnification from the boxes of Panels A–D, respectively. Cont is short for control. Scale bars: A–D, 100 μm; A′–D′, 30 μm; B*, 10 μm.

