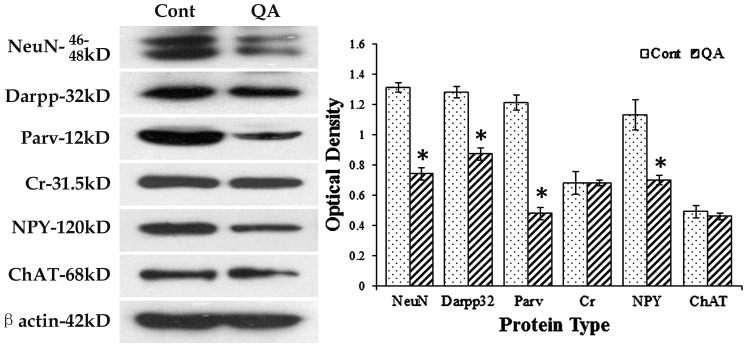
Figure 7. Western blots for marker proteins of different striatal neurons.
Western blots were applied to detect the expression levels of NeuN, Darpp32, Parv, Cr, NPY and ChAT after QA treatment. β-actin was used to control for equal protein loading. In the histogram, levels indicated in the bars are expressed as optical density (OD). The ODs of NeuN, Darpp32, Parv and NPY were significantly decreased while those of Cr and ChAT were not notably changed in QA-treated striatum when compared to the controls (Cont). Values are expressed as group means±SD. * P<0.01 v.s. control, Student's t-test.

