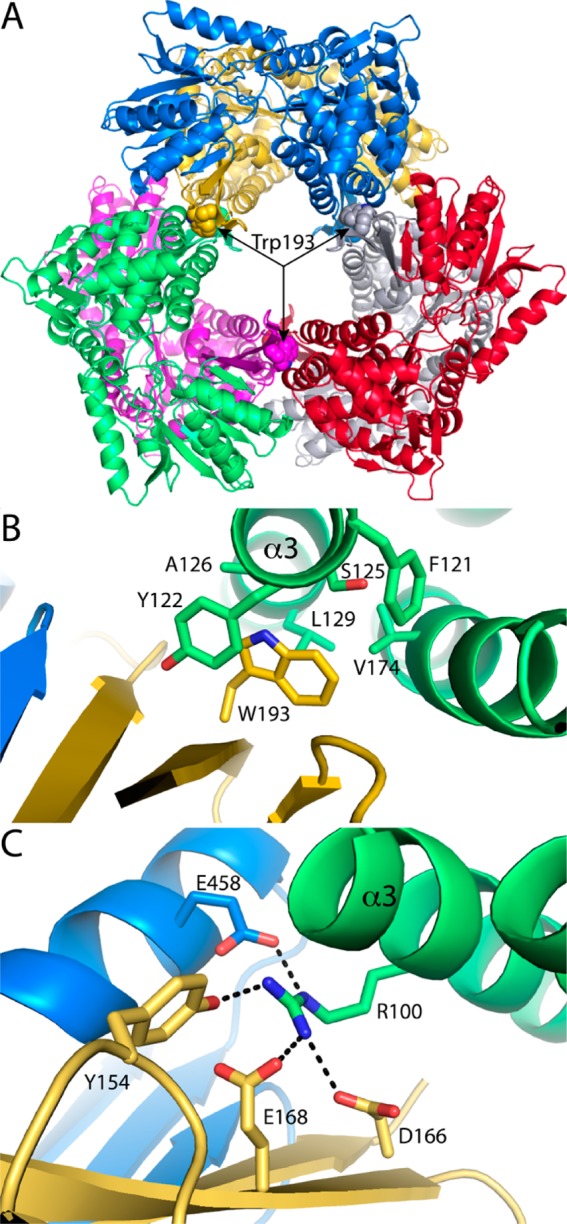
Figure 6.

Hexamerization hot spots of Put2p and TtP5CDH. (A) Put2p hexamer viewed down the 3-fold axis, showing the location of the hot spot centered on Trp193 (shown as spheres). The six chains have different colors. (B) Close-up view of the environment around Trp193 of Put2p. The chains are colored as in panel A. (C) Hot spot of TtP5CDH, which is centered on Arg100 of α3. The chains are colored as in panel A.
