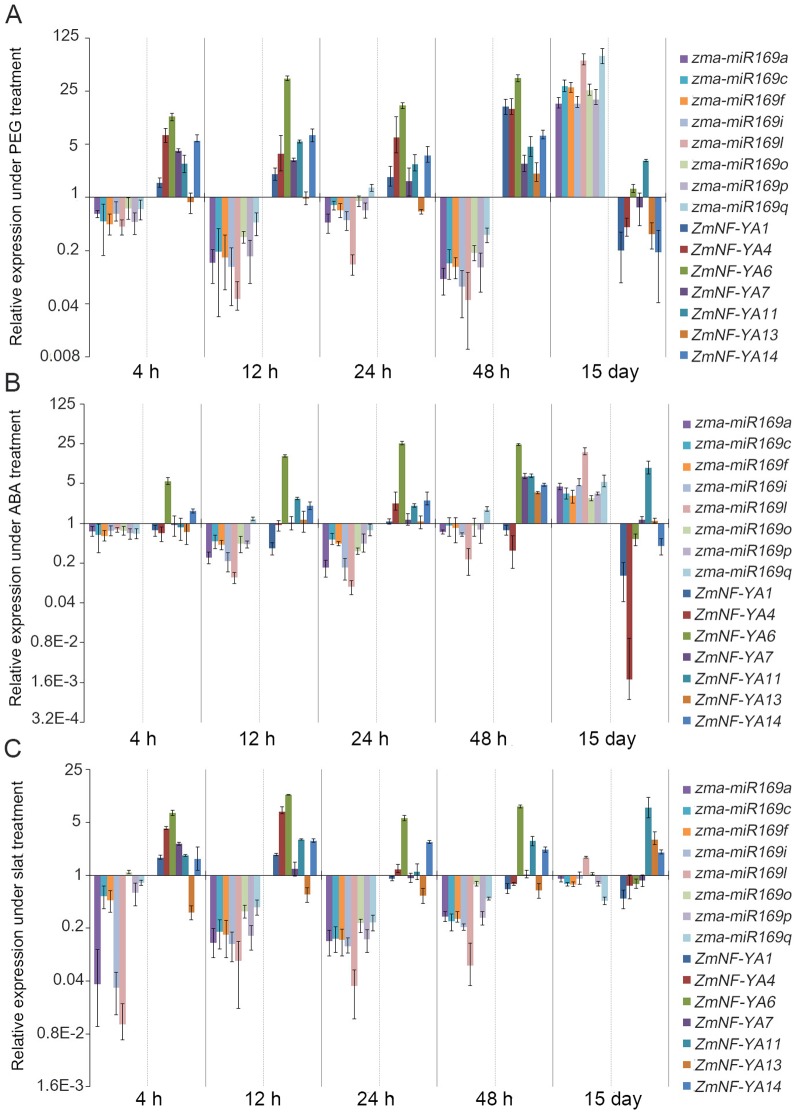
Figure 6. Expression profiles of mature zma-miR169s and ZmNF-YAs in roots in response to PEG (A), ABA (B), and salt (C).
Expression levels of U6 and Tub5 were used as internal references for expression of zma-miR169s and ZmNF-YAs, respectively. Values represent the means and the error bars represent standard errors for three independent experiments.

