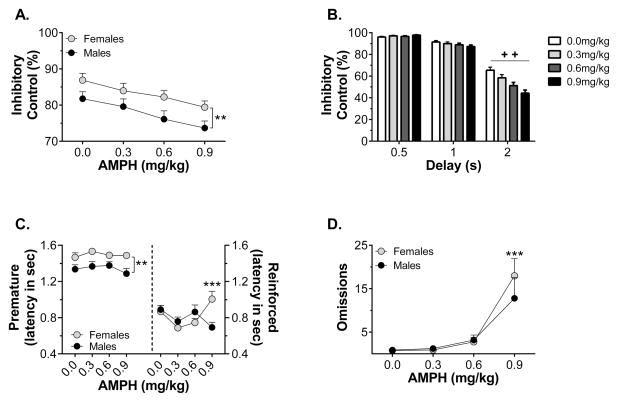
Figure 4.
Sex differences in the response to systemic AMPH injection and the effect of delay duration on the response to AMPH. Panel A shows inhibitory control following AMPH, collapsed across treatment group (n = 34–38/group). Panel B shows latency to lever press during the premature (left) and response (right) phases, collapsed across treatment group (n = 34–38/group). Panel C shows the number of trials omitted in each session, collapsed across treatment group (n = 34–38/group). Panel D shows the effect of AMPH on inhibitory control at each of the premature delay durations, collapsed across sex and treatment group (n = 72). ** p < 0.01, *** p < 0.001 vs males; + + all dose comparisons significant at p < 0.01 for this delay

